Designers are often tasked with presenting data. How do you present it in a way that can stand out when competing for data streams? Data is everywhere, from packaging labels to business reports. To get your message across, the visualizations have to engage the user in a way that stats alone cannot. According to YND..co software house company, to be able to do this effectively, designers and developers have to structure their information into a visual story that can be easily explored with your eyes. When information presents itself without a structural form, it is easy to get lost in them.
There are so many ways to represent data. It has to be both accurate and beautiful. Gone are the days when highly technical designers and developers alone were able to achieve this feat. With the introduction of graphic design software, the barrier of entry has significantly lowered. We have accumulated some of the best tools that can help you create beautiful data visualizations.

1. Plotly
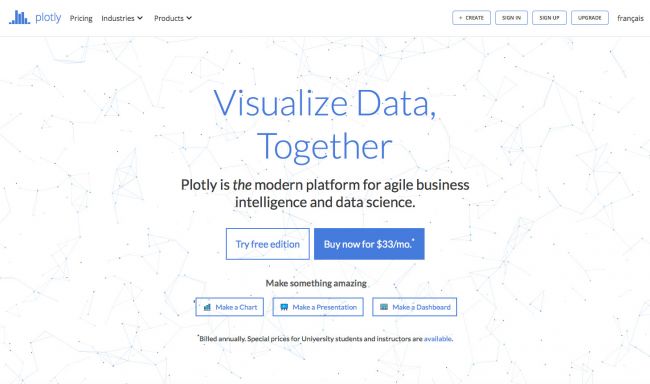
Plotly lets you create presentations, charts, and dashboards. It also has built-in software that lets you analyze your data using Excel, Javascript or Matlab. It is easy to import data and create amazing graphics with the help of their visualization library and online chart creation tool
2. Tableau
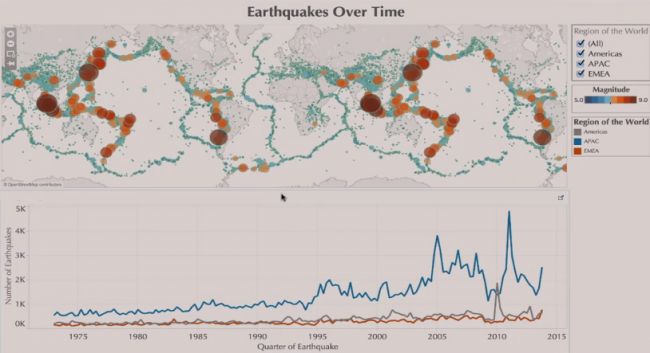
Tableau is a popular data visualization tool used by a lot of designers. It comes with built-in graphs, charts, maps and more. They make it easier to drag and drop content and with the live editor, you can watch the updates in real time. It is also easy to collaborate and work on projects with a team. The best part about it is that it is completely free!
3. Raw
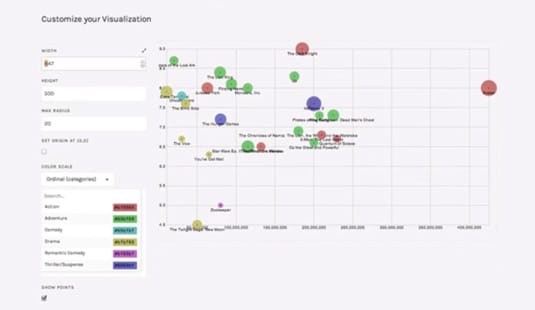
Raw is a great tool if you are looking to create data representations in a vector format. It is a free tool that lets you upload data from different devices. Once you have your representation, it can easily be exported as an SVG or PNG file and used on your website.
4. Visually
This is a gallery and infographic generation tool. Its beautiful interface and built-in features make it easy to generate stunning infographics that can stand out on their own.
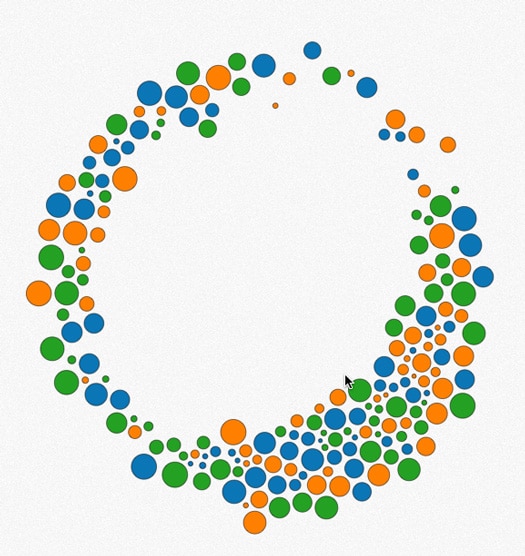
5. D3.JS
This is a great tool that converts data into amazing diagrams using HTML, SVG, and CSS. It is capable of producing some of the most advanced data visualizations with complex data sets. It is easily accessible and includes really good user support.
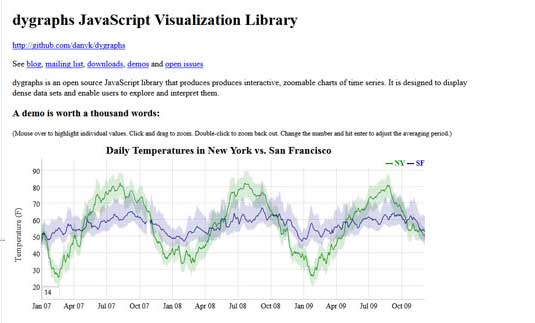
6. Dygraphs:
Dygraphs is capable of producing amazing data visualizations of dense data sets. It is customizable and works on different devices.
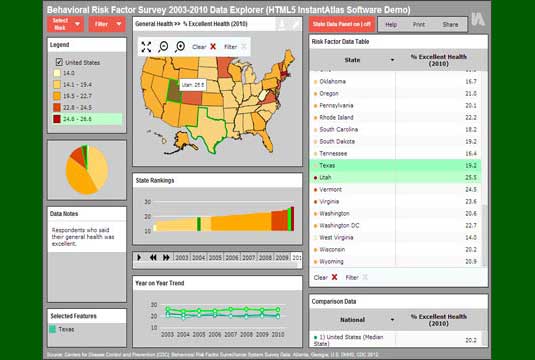
7. Instant Atlas:
If you are looking represent data combining statistics and mapping, this is a good tool to check out. It helps you to create dynamic profile reports that visualize your data with mapping.
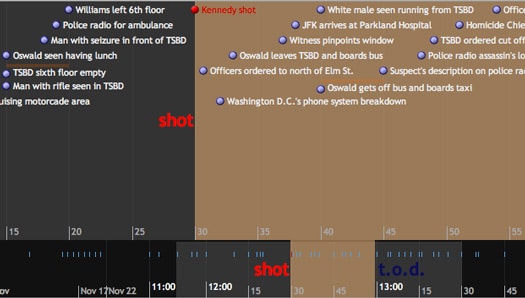
8. Timeline
Ever wanted to create a timeline that is interactive. This tool lets you do just that. Create advanced interactive timelines that respond to user prompts.
9. Modest maps
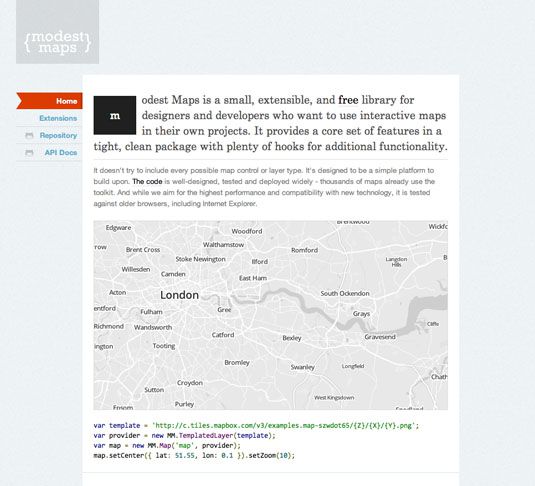
Modest Maps is a simple mapping tool that lets web designers create interactive maps that can easily be integrated into your site. It also allows users to add their own interaction code. This makes it a good choice for designers looking to customize their user experience of the website.
10. Leaflet
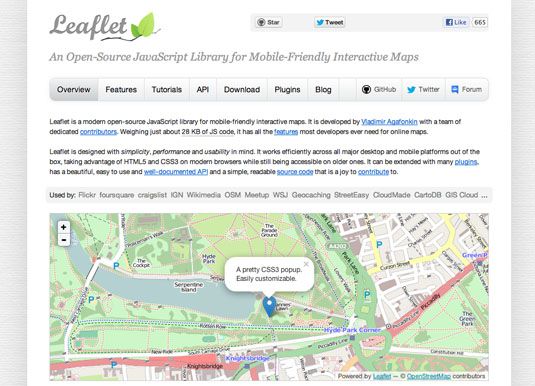
This is a good tool for representing data based off of geographic projections. With this tool, you are able to convert open street map data into an interactive data visualization s. With plug-ins available in the market lets you extend its functionality by adding masks, heat maps, and animated markers.
11. Canva
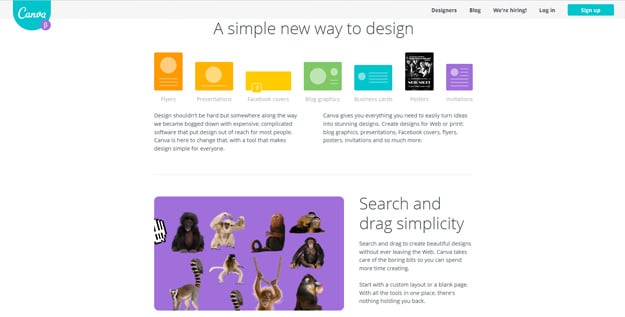
Canva lets you easily create flyers, business cards and other graphics without the need for using graphic design software like Photoshop and Illustrator. It has over a million graphics and its library comes with pre-built drag and drop builder that lets you create any graphic with ease.
12. Infoactive
Infoactive lets users create custom infographics that can be easily built to be interactive. This is a great alternative if you don’t want to hire a professional designer to create one.
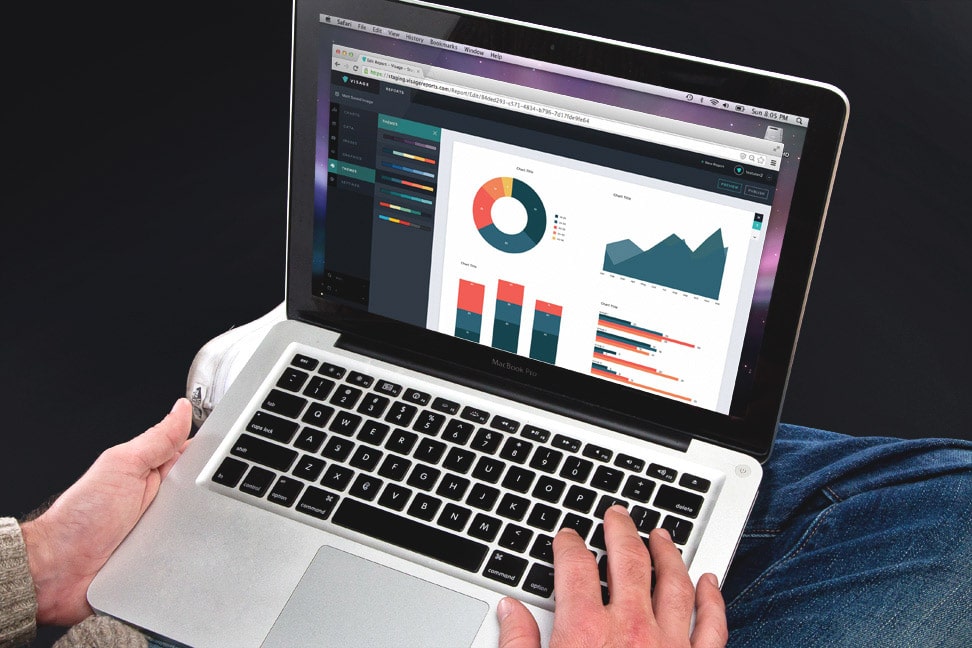
13. Visage
This tool lets you create volumes of chart heavy user reports and infographics. Use this tool if you are a large brand looking to represent volumes of data.
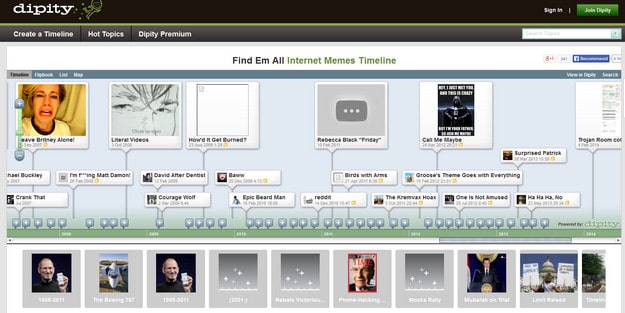
14. Dipity
Dipity lets you create beautiful timelines with interactive elements. Create up to 150 events with their free account. Each event is clickable and comes with links to share timeline on social media.
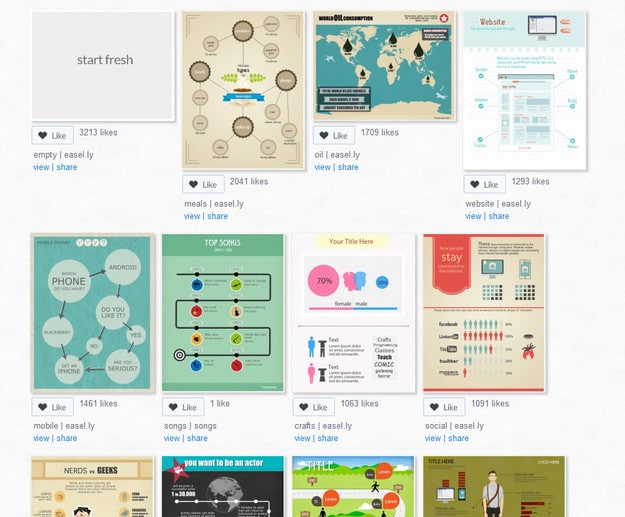
15. Easel.ly
This tool can be used as a great starting point for your designs. It comes with dozens of pre-built templates. Choose one of them and customize it to create your own design. This is free software and is easily accessible.
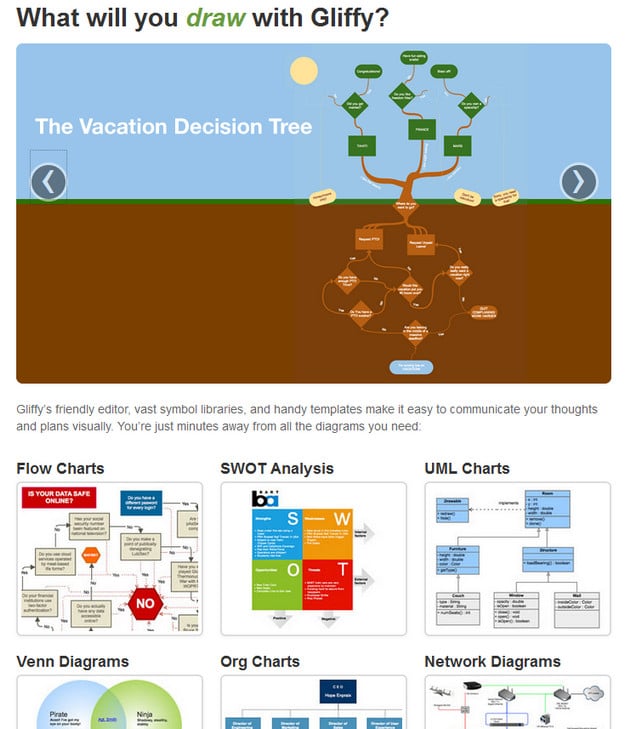
16. Giffy
Giffy is a simple tool used by designers to create diagrams and flowcharts. It has pre-built drag and drop builder that lets you build pages with ease.
17. Lovely Charts
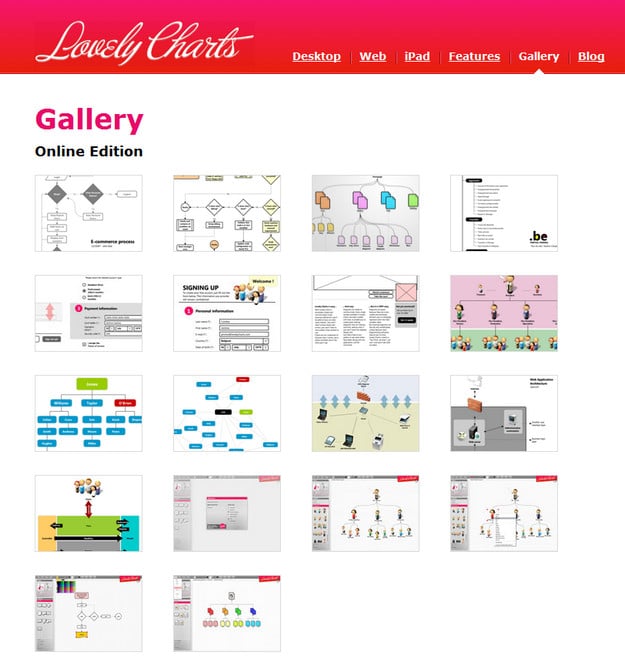
What sets this tool apart from the other software is its cross-functionality. It is available across all devices. You can drag and drop it to build your own pictographs or use a set of available options for their template library. The final file can easily be exported as a Jpeg, PNG or PDF.
The post 17 Data Visualization Tools for Web Designers & Developers appeared first on Web Design Blog | Magazine for Designers.
via http://bit.ly/2RE8M9P

No comments:
Post a Comment