In terms of descriptive statistics, perhaps one of the most modern branches of this is data visualization. Using infographics and charts, descriptive statistics are used to both study and create various visual representations of different kinds of data. These sorts of graphs and charts are then placed into JavaScript libraries, which can then be used to assist you in presenting and focusing on important information easily.
The aspect of a dashboard that lacks charts and graphs is, in essence, virtually impossible to fathom. Not only do charts and graphs present statistics in an effective manner, but they also greatly enhance your website’s overall design.
Many various tools have become available for developers and designers alike in recent years, which allow them to perform such activities as creating different graphs and charts which can then be placed into various applications and websites. These tools have the ability to be used by JavaScript as opposed to static imaging and Flash.
When considering what kind of charting library to utilize in an application or website, it’s important to note that your choice can make a major difference in terms of whether or not a user’s experience with is good or bad.
This article will showcase a list of the best JavaScript libraries available.
Chart.js

Simple, clean and engaging charts for designers and developers. Visualize your data in 6 different ways. Each of them animated, with a load of customisation options and interactivity extensions.
Chart.js uses the HTML5 canvas element. It’s supported in all modern browsers, and polyfills support for IE7/8. Chart.js is dependency free and super lightweight. All six core chart types are only 11.01kb when minified, concatenated and served gzipped.
D3.js

D3.js is a JavaScript library for manipulating documents based on data. D3 helps you bring data to life using HTML, SVG, and CSS. D3’s emphasis on web standards gives you the full capabilities of modern browsers without tying yourself to a proprietary framework, combining powerful visualization components and a data-driven approach to DOM manipulation.
NVD3
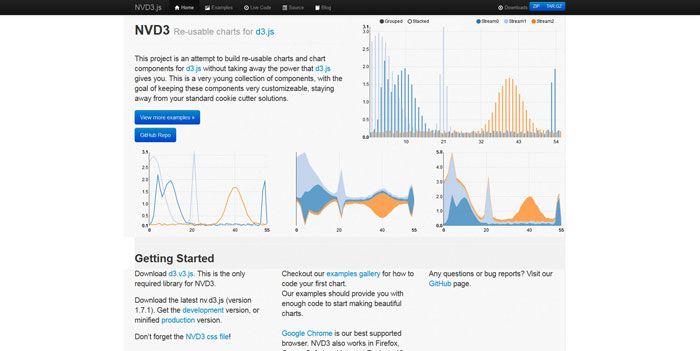
This project is an attempt to build re-usable charts and chart components for d3.js without taking away the power that d3.js gives you. This is a very young collection of components, with the goal of keeping these components very customizeable, staying away from your standard cookie cutter solutions.
amCharts
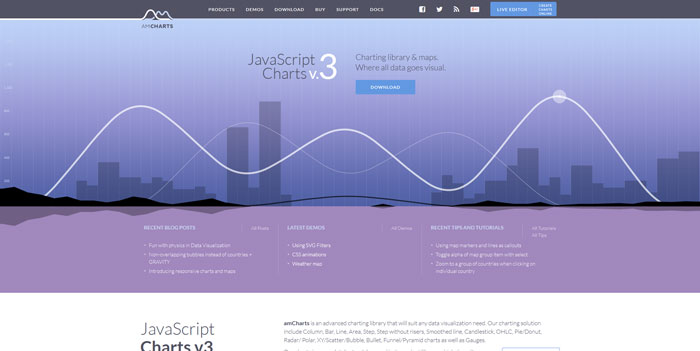
amCharts is an advanced charting library that will suit any data visualization need. Our charting solution include Column, Bar, Line, Area, Step, Step without risers, Smoothed line, Candlestick, OHLC, Pie/Donut, Radar/ Polar, XY/Scatter/Bubble, Bullet, Funnel/Pyramid charts as well as Gauges.
C3.js

C3 makes it easy to generate D3-based charts by wrapping the code required to construct the entire chart. We don’t need to write D3 code any more. C3 gives some classes to each element when generating, so you can define a custom style by the class and it’s possible to extend the structure directly by D3.
dc.js

dc.js is a javascript charting library with native crossfilter support and allowing highly efficient exploration on large multi-dimensional dataset (inspired by crossfilter’s demo). It leverages d3 engine to render charts in css friendly svg format. Charts rendered using dc.js are naturally data driven and reactive therefore providing instant feedback on user’s interaction.
D3xter
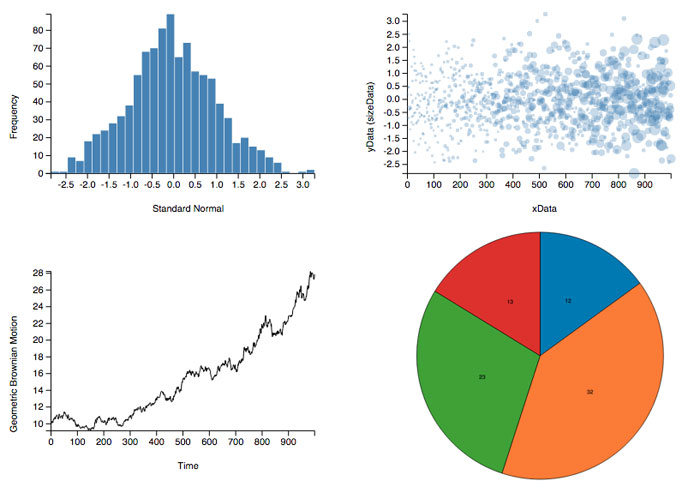
Generate common charts with extremely simple functions. Functions return SVG objects which can be customized as needed using D3.js syntax.
Epoch

A general purpose real-time charting library for building beautiful, smooth, and high performance visualizations. Built with developers in mind, making it easy to extend and adapt charts to your particular domain. Features five beautiful and high performance real-time charts built using d3 & Canvas.
Addepar

A charting library built with the Ember.js and d3.js frameworks. It includes time series, bar, pie, and scatter charts which are easy to extend and modify. The out-of-the-box behavior these chart components represents our thoughts on best practices in chart interactivity and presentation.
MetricsGraphics.js

MetricsGraphics.js is a library built on top of D3 that is optimized for visualizing and laying out time-series data. It provides a simple way to produce common types of graphics in a principled, consistent and responsive way.
Raphaël

Raphaël is a small JavaScript library that should simplify your work with vector graphics on the web. If you want to create your own specific chart or image crop and rotate widget, for example, you can achieve it simply and easily with this library.
Pizza Pie Charts

Creating responsive pie charts for any device is a piece of pie. Deliver pie charts to any device with Pizza. Your pie will be steaming hot with SVG so that it looks good on retina devices and HiDPI devices.
Tinychart: A simple tool to create and export beautiful charts in minutes

Chartist.js

You may think that this is just yet an other charting library. But Chartist.js is the product of a community that was disappointed about the abilities provided by other charting libraries. Of course there are hundreds of other great charting libraries but after using them there were always tweaks you would have wished for that were not included.
dimple

An object-oriented API for business analytics powered by d3. The aim of dimple is to open up the power and flexibility of d3 to analysts. It aims to give a gentle learning curve and minimal code to achieve something productive. It also exposes the d3 objects so you can pick them up and run to create some really cool stuff.
jQuery Sparklines

This jQuery plugin generates sparklines (small inline charts) directly in the browser using data supplied either inline in the HTML, or via javascript.
Sparky

Sparklines are intense, simple, word-sized graphics. Sparky is a JavaScript library for drawing them dynamically in your web browser. In the words of Edward Tufte, who coined the term:
Sparklines mean that graphics are no longer cartoonish special occasions with captions and boxes, but rather a sparkline graphic can be everywhere a word or number can be: embedded in a sentence, table, headline, map, spreadsheet, graphic.
Peity

Peity (sounds like deity) is a simple jQuery plugin that converts an element’s content into a simple svg mini pie donut line or bar chart and is compatible with any browser that supports svg: Chrome, Firefox, IE9+, Opera, Safari.
jsPlumb
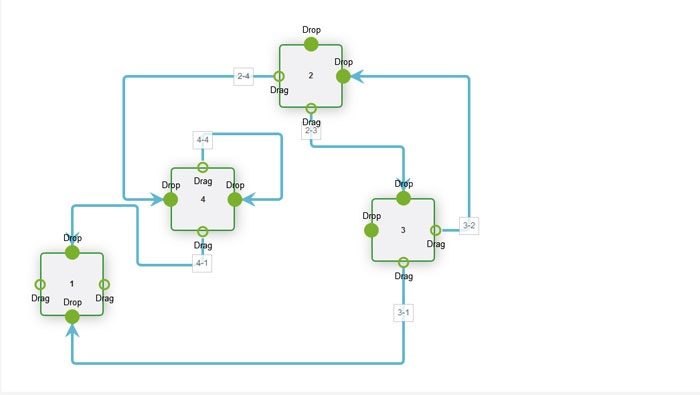
sPlumb provides a means for a developer to visually connect elements on their web pages. It uses SVG or Canvas in modern browsers, and VML on IE 8 and below.
tauCharts

tauCharts is a Javascript charting library based on D3. Javascript charts with a focus on design and flexibility
vis.js

A dynamic, browser based visualization library. The library is designed to be easy to use, to handle large amounts of dynamic data, and to enable manipulation of and interaction with the data.
Timesheet.js

Visualize your data and events with sexy HTML5 and CSS3. Create simple time sheets with sneaky JavaScript. Style them with CSS and have mobile fun as well.
xCharts

xCharts is a JavaScript library for building beautiful and custom data-driven chart visualizations for the web using D3.js. Using HTML, CSS, and SVG, xCharts are designed to be dynamic, fluid, and open to integrations and customization.
You will definitely like these articles

Source: http://ift.tt/1IU0ooR


