Creating infographics and creating them well is not an easy task, it’s actually a challenge and requires a designer to get documented first, practice and only afterwards to actually design one for a client.
Infographics are a visual representation of information and is quite popular these days due to the fact that everything that is visual is almost automatically well received by the public. This has made data visualization a thing that “must be done” by every designer, and that is almost always a bad thing.
Creating good data visualization is not the same as designing a brochure, flyer or a poster. The problem is that many ignore this aspect and keep doing it by their own rules, which can only be a stupid thing to do.
The purpose of infographics is to visualize data, to communicate information clearly and efficiently. As you will see in the following examples, the designers who made these masterpieces haven’t been able to communicate information clearly and efficiently at all, instead they complicated things or they managed to add incorrect data which can only confuse the viewers.
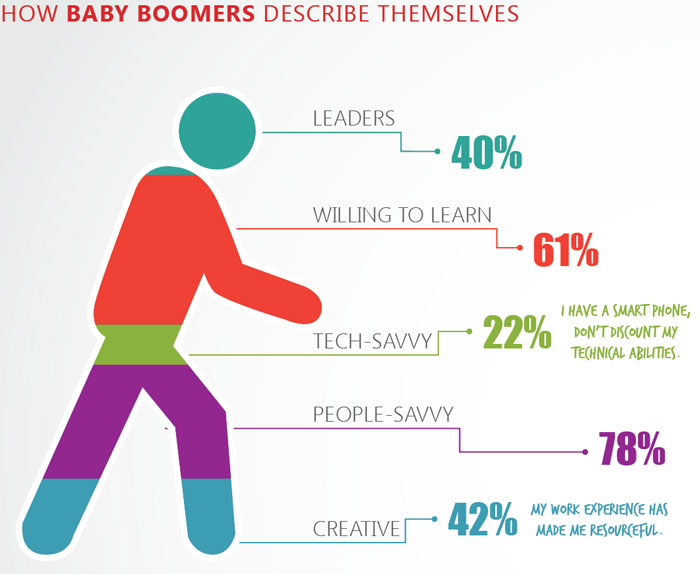
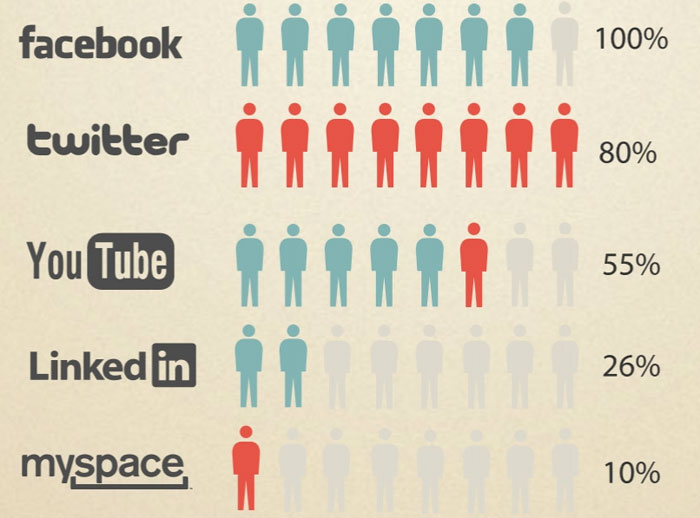
He’s 243% baby boomer
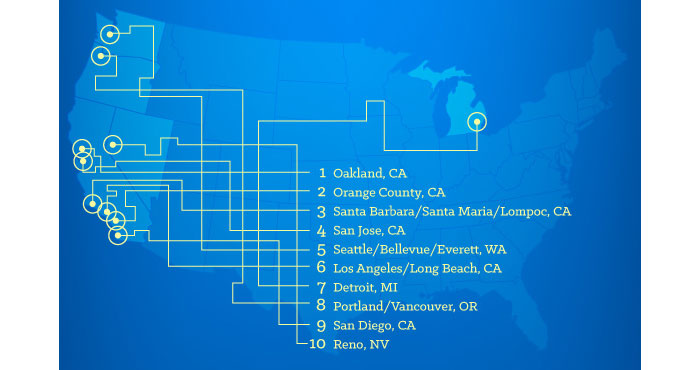
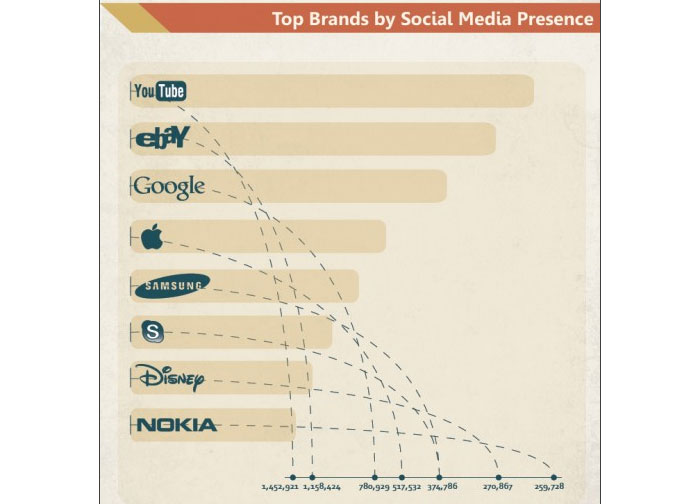
As the crow flies
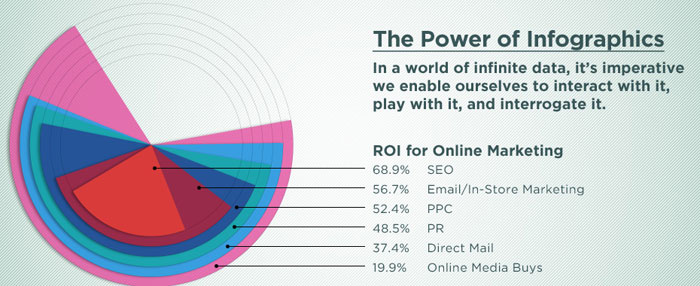
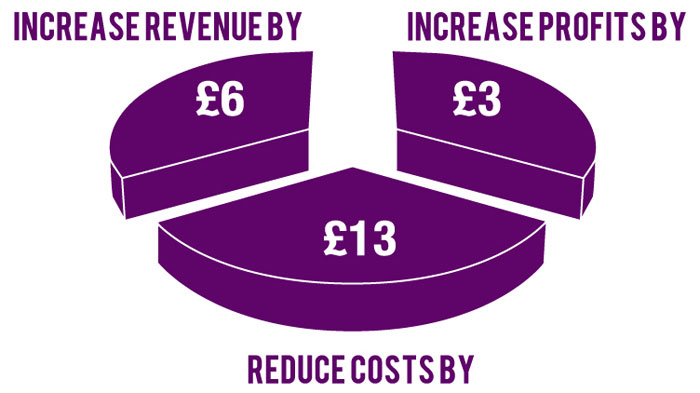
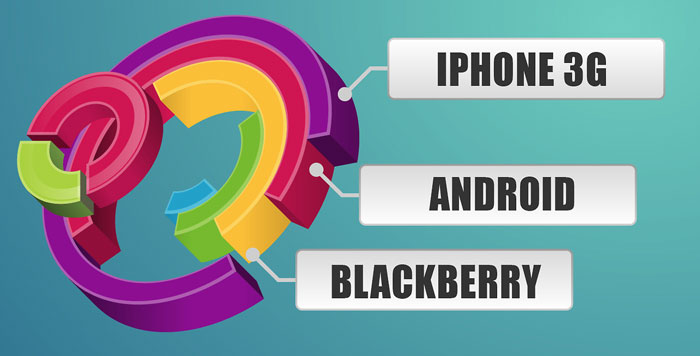
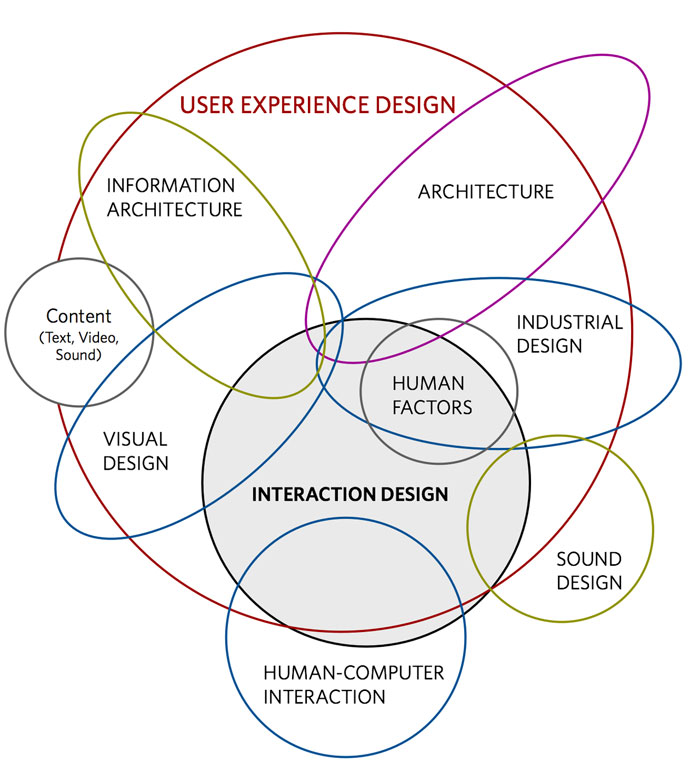
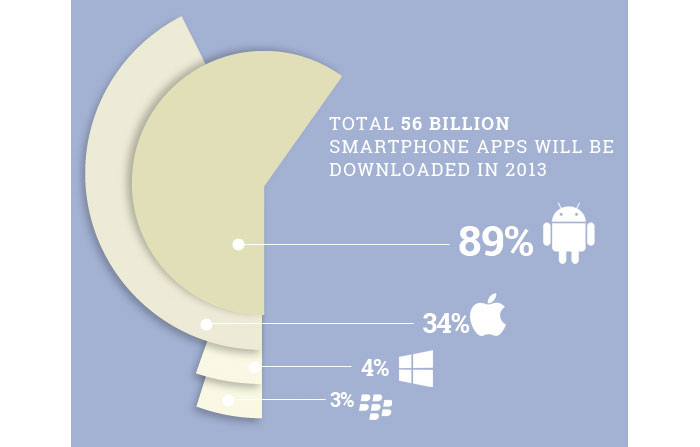
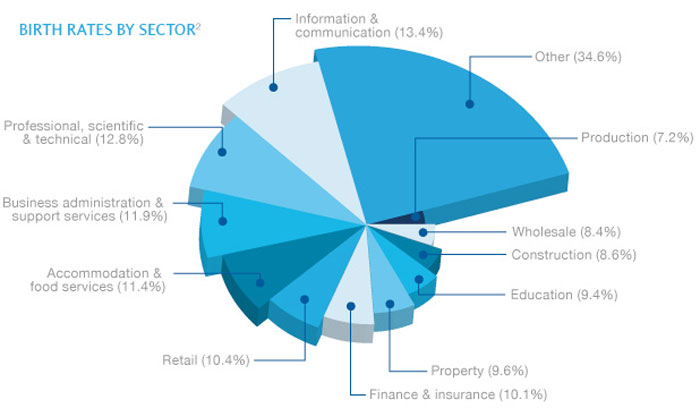
You know you’re in trouble when your design firm opts for the overlapping wedges for their homepage banner
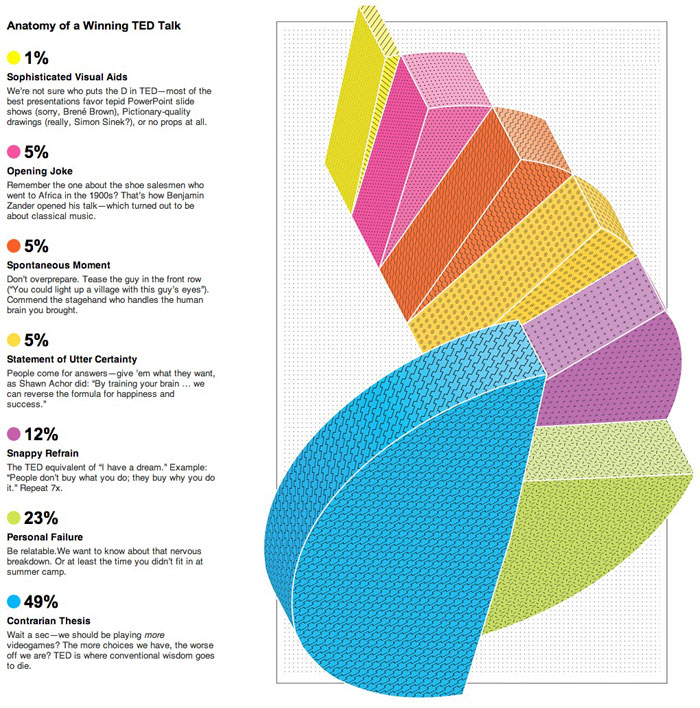
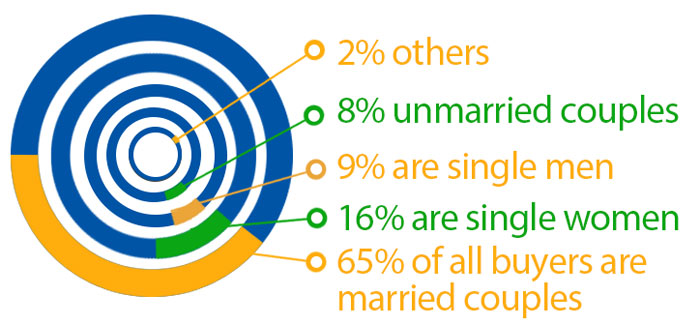
The spiral staircase
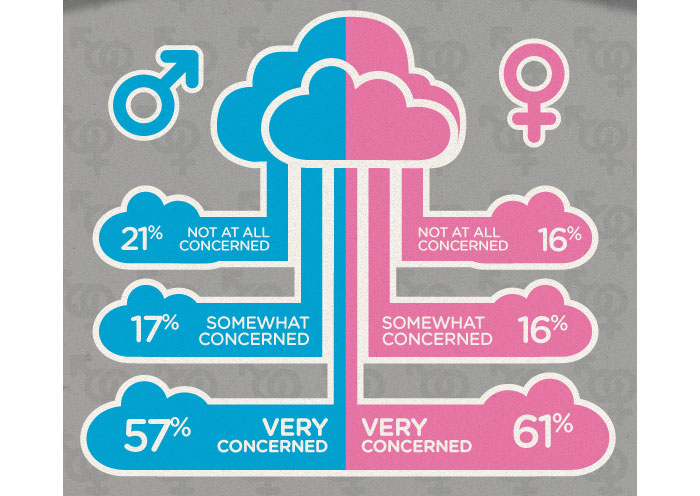
100% chance of cloudy data
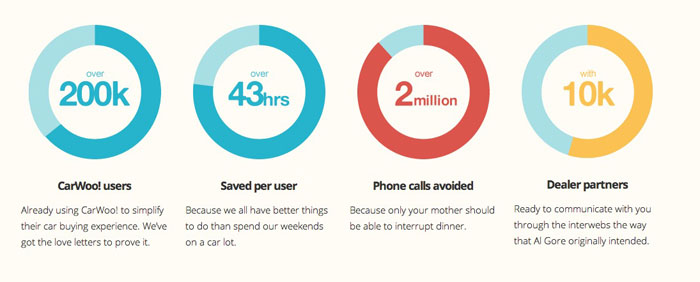
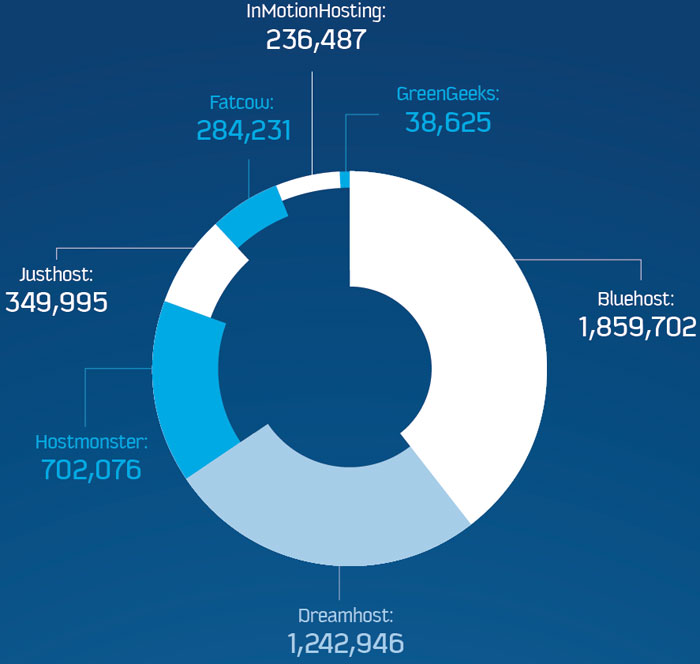
Donut charts are mostly for decoration, right?
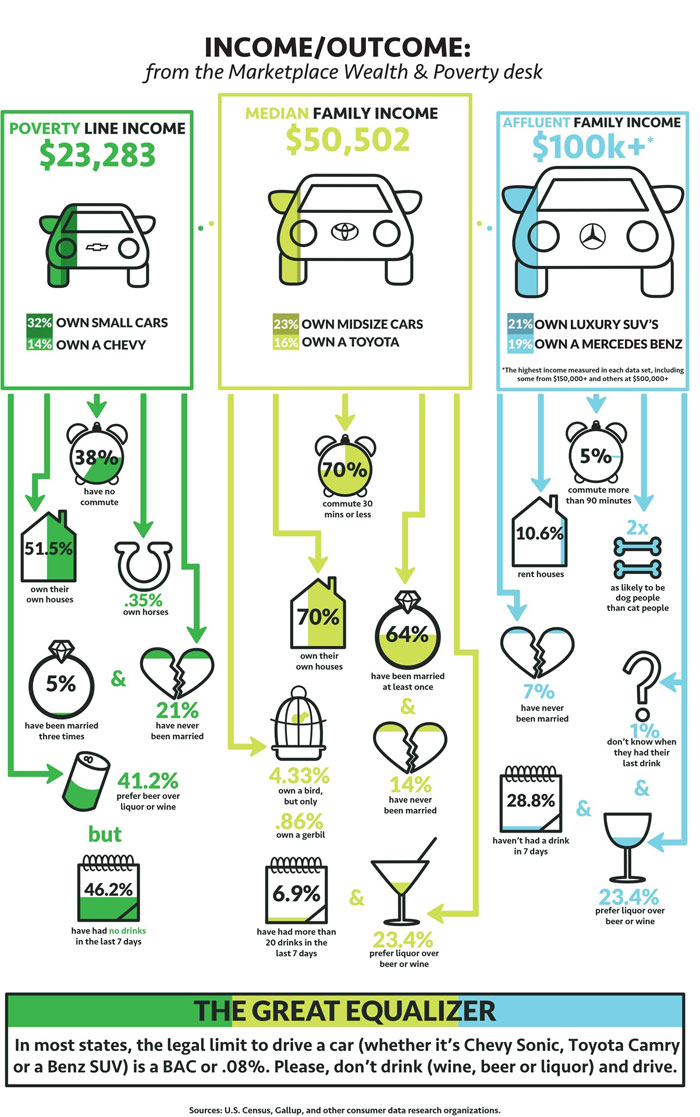
Ugh, poor people
Apparently we are supposed to make a connection between income, driving and ???
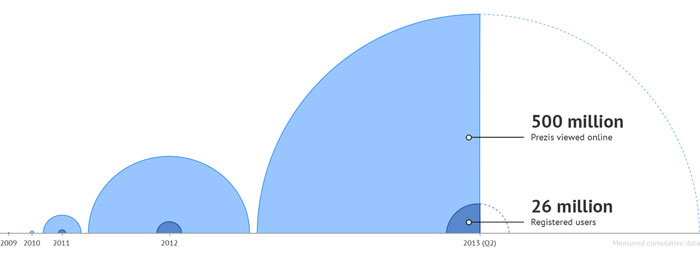
Lovely user humps
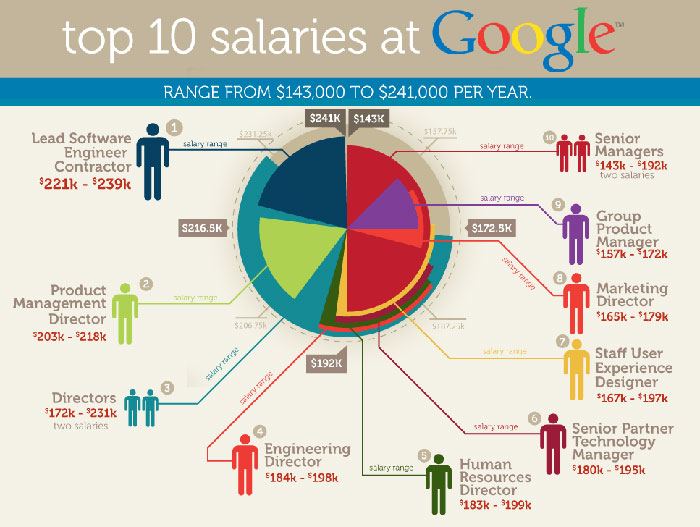
Top 10 salaries at Google
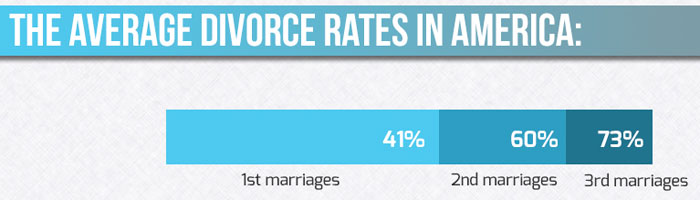
Divorced from data
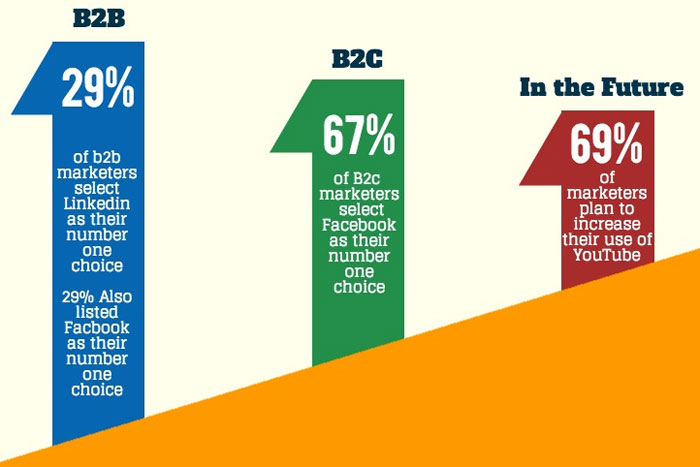
In the future
Parabolic labeling
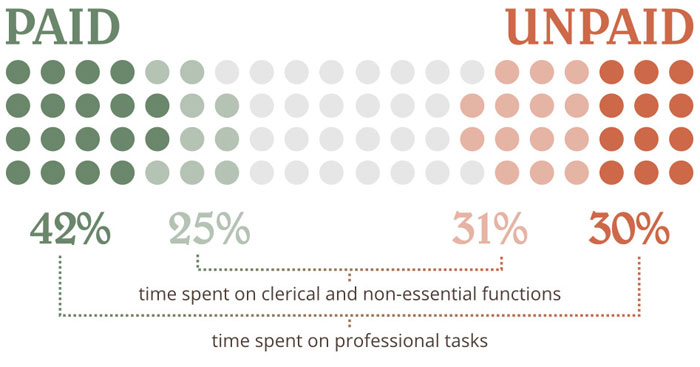
Unpaid design work
Blueberry pie
Recursive donuts
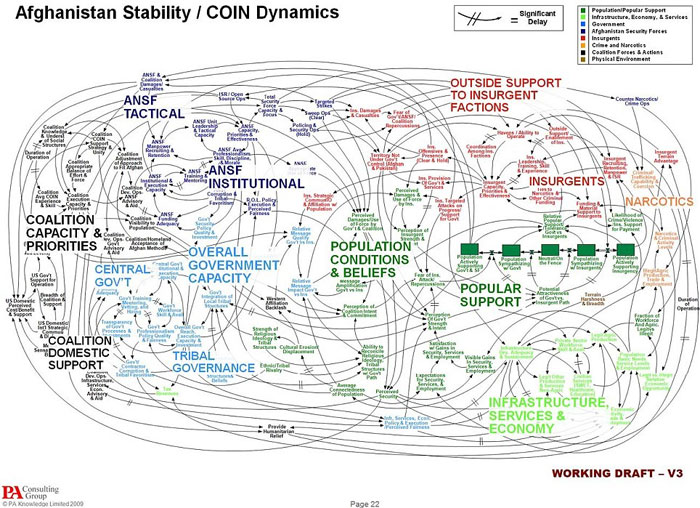
Just a working draft
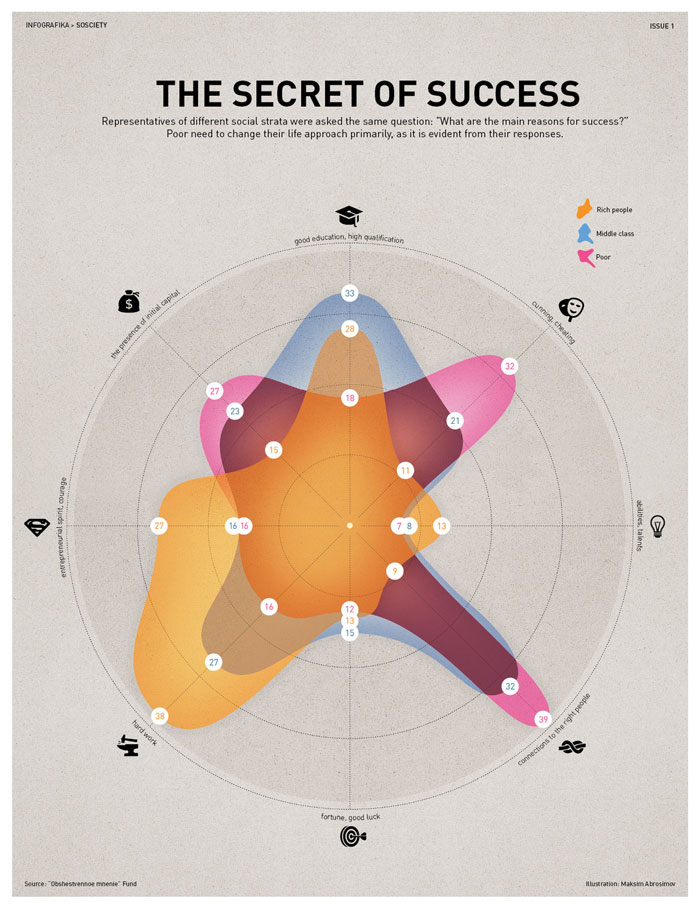
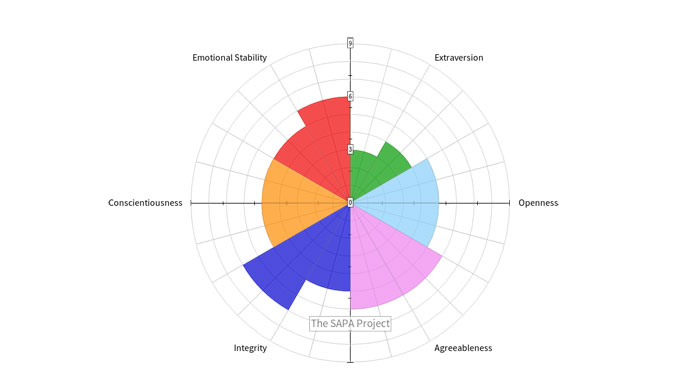
Personality circle
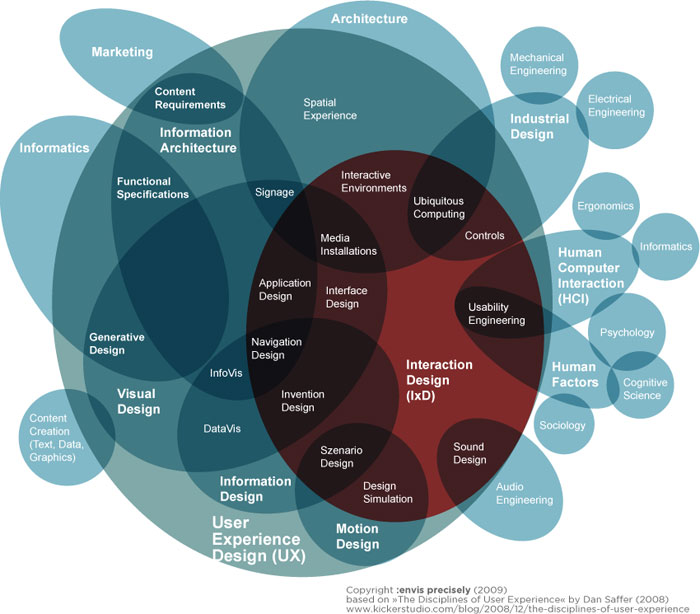
Mindmap mindfuck
The donut ring explosion
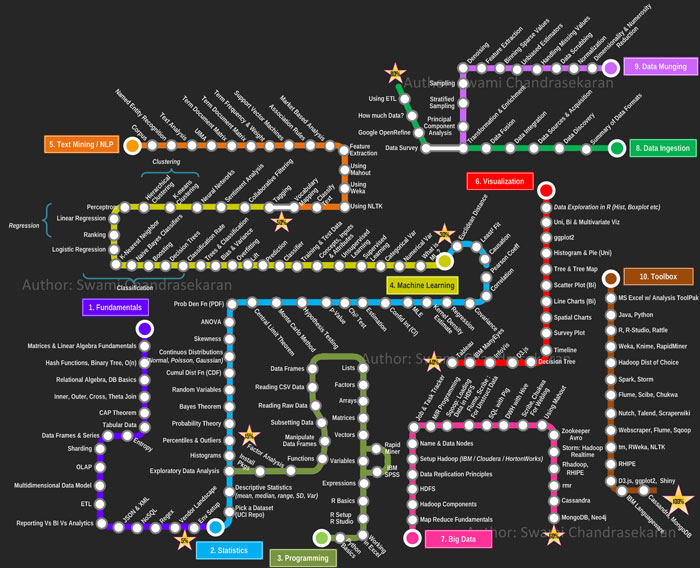
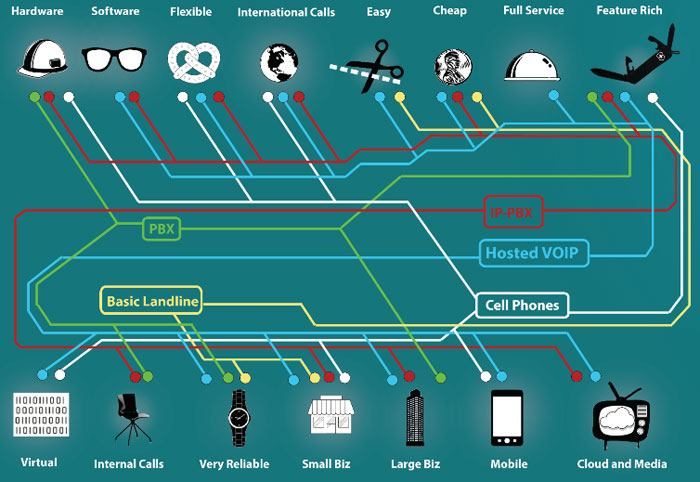
Disconnected subway map? Sequential, linear relationships?
Fantastically designed user experience. /s
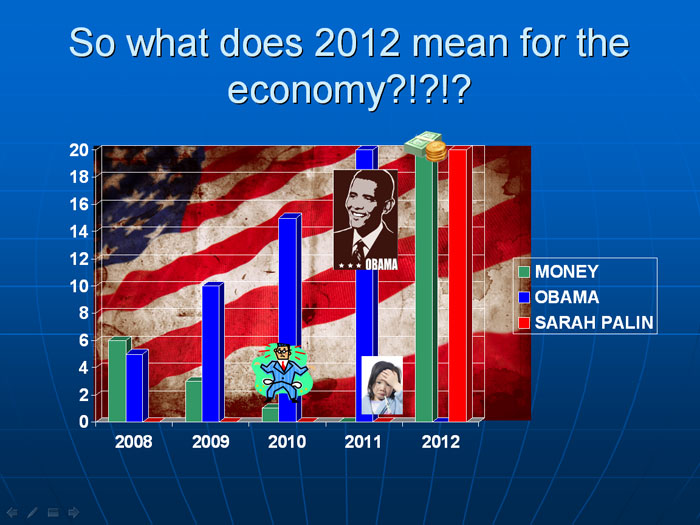
20 Obamas is just too much for our economy
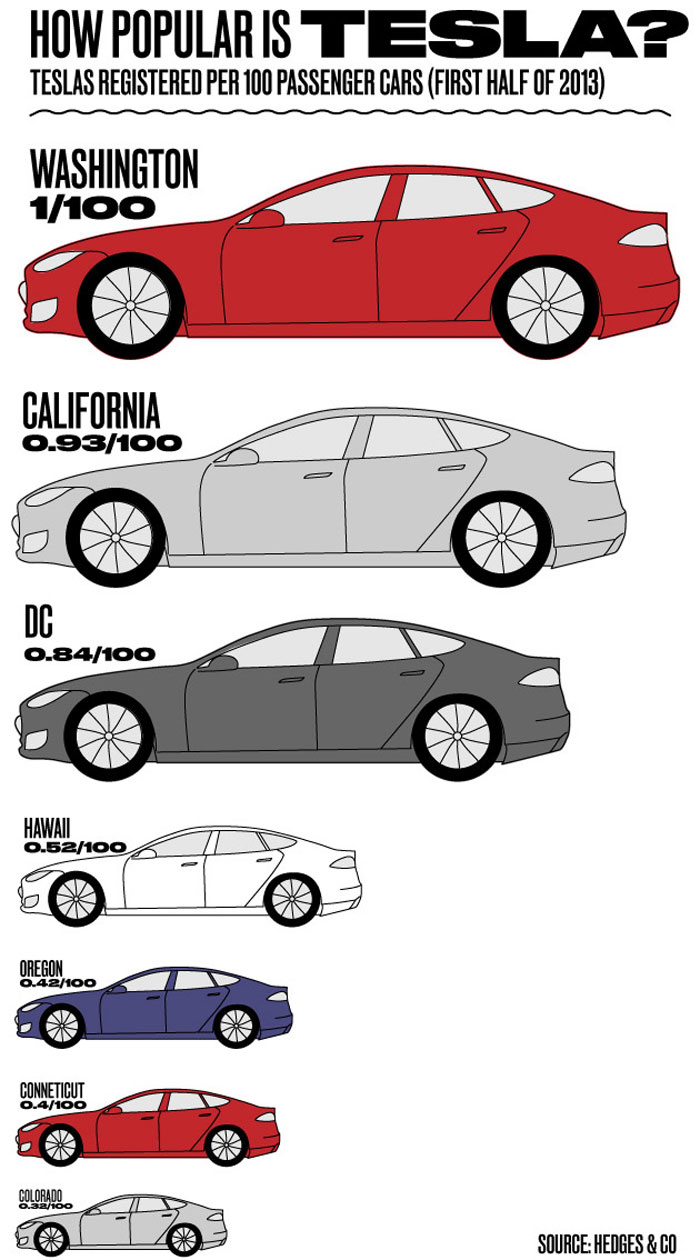
Honey I shrunk the car
Well, that clears things right up. /s
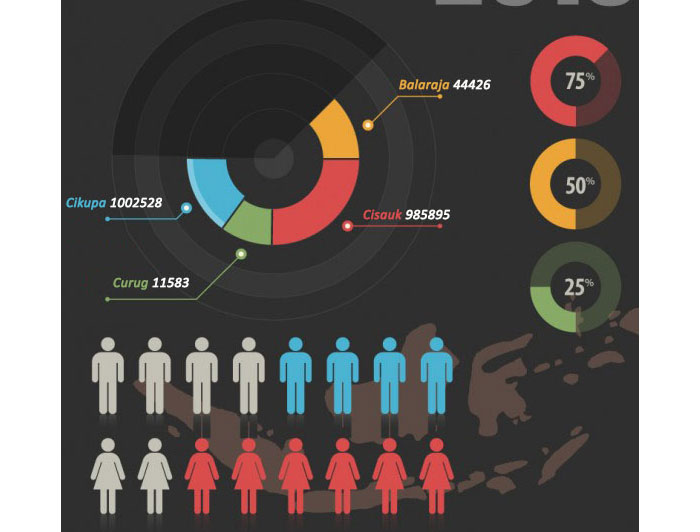
Pay close attention to the 75% donut chart
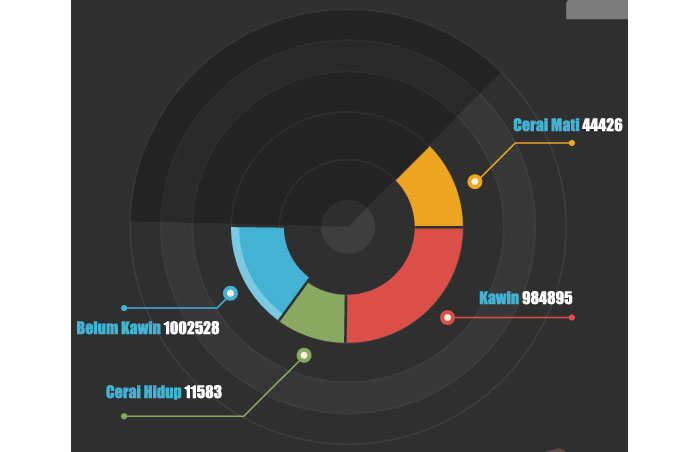
Data darkness
The layered pie slices
The percentages
The nautilus
The dehydrating donut chart
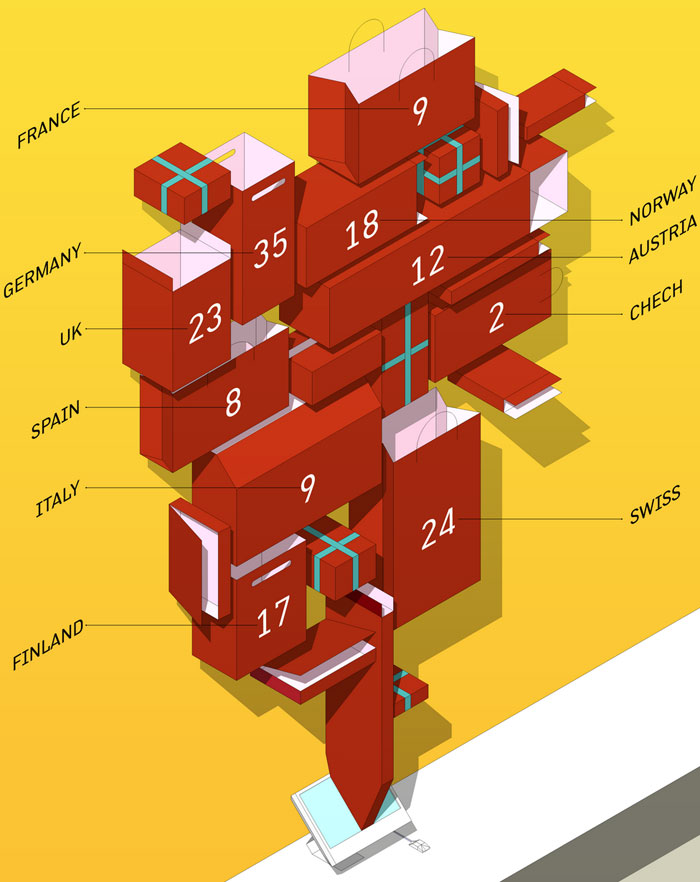
Let the data out of the bag
You will definitely like these articles
Source: http://feedproxy.google.com/~r/DesignResourceBox/~3/7jEOfKxt86I/


No comments:
Post a Comment