WordPress is a CMS platform that is written in PHP. It is one of the most popular platforms for creating your website and stands tall in front of other worthy competitors like Squarespace, Shopify, and other CMS’s. Many people rely on WordPress for creating their websites. It is also a controlled environment with a lower frequency of errors compared to other CMS. However, even if there is a small window for errors, problems can crawl in there and put your website at risk.
WordPress has a diverse range of tools and functionality that it provides to the users. Hence, with more diverse features comes the chance of more potential errors that the users can encounter. WordPress follows an open plugin architecture that allows the users to add additional features to the CMS. There is a web server, a database management system, a hosting provider, and a network. These individual factors can contribute to their share of potential problems.
The need for debugging tools:
There are many problems that a user can face, such as incorrect or damaged content, slow performance, error messages, or even a white screen of death. WSOD generally means that your website has crashed and requires immediate attending. In these competitive times, especially in the virtual world, a delay of 2 seconds to load a website can take your potential users to your competitors. It could also affect your SEO performance. Hence, it is crucial to have tools that keep your website in perfect health. Even if your website is in perfect health, using these 8 must-have effective tools would improve your site’s usability and performance.
What is debugging?
Debugging is a process developers take on for detecting and removing errors (bugs) from their programs. They use specialized tools that allow them to see the functioning of the program. This helps them identify any abnormalities in the program when it is being executed. At times even with the most effective tools, it can be difficult to identify the exact command, component, or instruction behind the error. Hence, you compare these debugging tools to a doctor’s diagnosis that helps them identify the health problem’s cause and then treat it accordingly. Here are some of the must-have debugging tools for WordPress website that are worth your consideration and time:
1. Query Monitor:
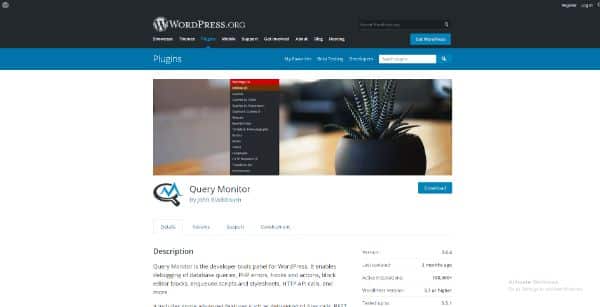
This free debugging tool helps to assess the performance of your website. This allows the user to get an in-depth analysis of all requests made to their server, including hooks and actions, database queries, HTTP requests, and much more. You can use it to detect a script, plugin, or database query that can negatively affect your website’s load times.
If you are done troubleshooting normal error reasons to fix the issue, and your website is still loading slowly, making use of Query Monitor would help you explore your website’s functionality that would help you identify the problem better. With Query Monitor, you can solve debugging issues related to:
- Template Hierarchy
- Redirects
- Translation Files
- Broken scripts and style dependencies
- Ajax calls
- Hooks and actions
- REST API requests
- Rewrite rules
- Template parts
- HTTP API requests
2. Debug Bar:
Debug Bar is very popular and trusted globally as a useful debugging tool for WordPress websites. It uses WP Admin. It works great if you want instant access to the cache, query, and any other debugging information forms. When a user installs this plugin, they would be able to see the tool in the website’s admin bar on the top. This allows the user to have instant access to debug information on both the back and front end of their sites.
You could also dive more in-depth and explore additional debugging capabilities of the Debug bar, such as:
- Exposing and tracking MYSQL queries by enabling the SAVEQUERIES enabled. This helps the user to detect performance issues on their website or build a tailored WordPress functionality.
- Enable ‘WP_DEBUG’ for enabling tracking of PHP warnings and notices. Doing this would make finding errors in your codes way easier.
3. New Relic:
New Relic is one of the most prominent names in the Application Performance Monitoring industry. It is a commercial product made by thousands of developers worldwide for having an efficient platform to perform insights about their software products. It is available as a plugin that can also accommodate added functionality from third parties. This diversifies the use and permutation combinations of technologies that can be monitored with ease using this tool.
You do need to invest considerable money behind this, as well as time and willingness to learn. New Relic comes with a steep learning curve. Still, once you get the hang of it, their easy integration into applications for infrastructure and APM monitoring makes it worth it.
4. Firefox Developer Tools:
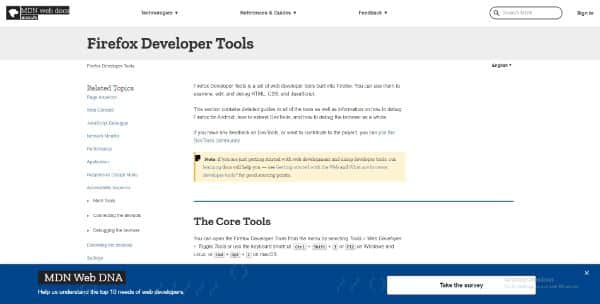
Firefox Developer Tools is a developer-focused tailored version of Firefox. It offers them the latest development feature tools. This tool is not specific for WordPress but can be used to debug any platform based websites. They have a solid layout that stands out. You can right-click on any element and pull up the inspector tab. The web console also provides a rich output when you print objects, showing up much more information than just the object’s name. Hence developers can have a detailed examination of the object’s properties and access richer information for the DOM elements.
You can use their Inspector tool to examine and modify CSS and HTML of a page, even if you have those pages loaded locally on Firefox or any remote device that supports Firefox. Their web console can show you all the important information you would need as a developer: CSS warnings, JavaScript, network requests, informational messages logged by JavaScript code, and more.
5. Theme Check:
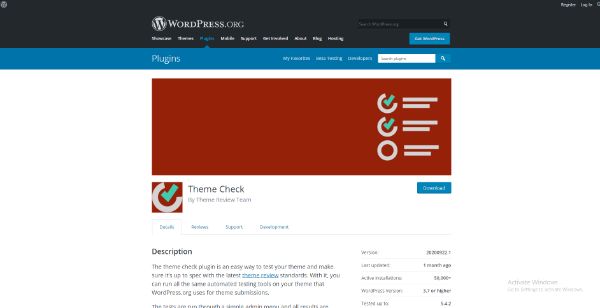
Theme Check is an aid to any theme developer. It is widely popular amongst them developers. This debugging tool allows users to test their WordPress themes according to the latest coding practices and standards.
Being able to test their WordPress themes before submitting it to the repository reduces the chances of the theme being rejected. It also ensures that your theme complies with the best coding practices.
6. User Switching:
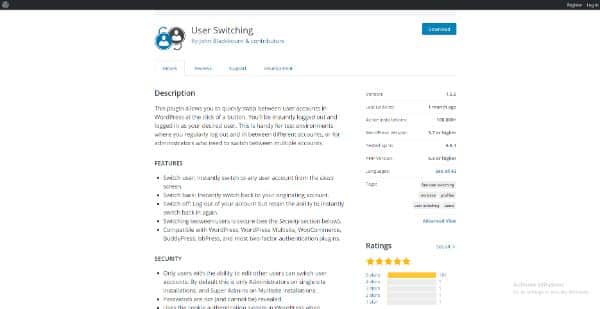
This is a debugging tool that lets the user switch between different user accounts with a single click. This ease of switching accounts is incredibly helpful when your work requires you to manage multiple user accounts. It can also be useful for testing and debugging user roles and privileges. After adding this plugin, you just need to click ‘Switch To’ from the Users menu.
You can keep switching accounts from here, and this plugin doesn’t even need special permissions or privileges. Keep in mind that the original account would need to have administrator privileges to enjoy this fancy feature of switching accounts without needing passwords to work.
7. WP Reset:
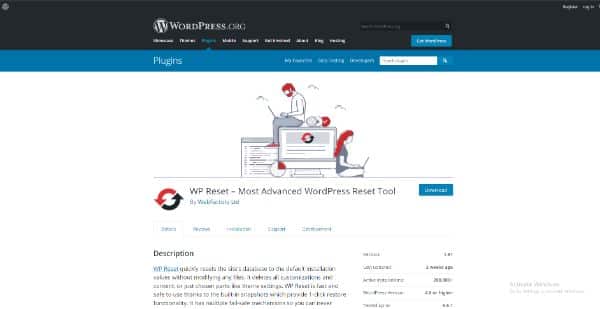
This is one of the best tools for anyone who needs to reset their database. This plugin has the ability to reset the database of default installation values without having to modify or affect any other files. It is capable of deleting any customization and content added. It has been deemed safe and effective to use by many customers.
The safety of this tool has been given a lot of consideration. It comes with multi fail-safe mechanisms that ensure you don’t lose data by accident. WP Reset is extremely useful for plugin and theme developers. This plugin helps speed up the testing and debugging feature. It allows the user to reset their WordPress settings quickly.
WP Reset is also entirely integrated with WP webhooks plugins. This plugin is a secure, universal network that helps the user connect any WP to any third parties and enable them to initiate actions from WordPress’ end and other applications. It also has useful features such as one-click reset that makes the process of resetting and debugging any WordPress site quicker and effortless.
8. Debug This:
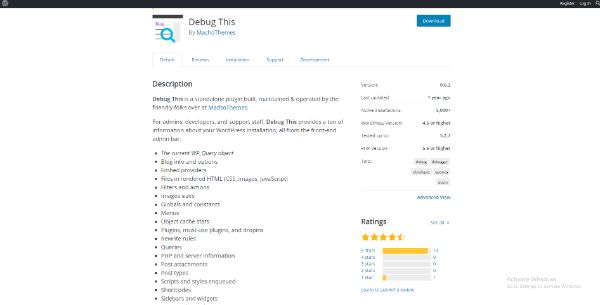
This is an essential plugin that gives developers access to the front-end WordPress installation process through the admin bars. This plugin has over 49 debug modes. A user can render page analysis for JavaScript and CSS and debug sidebars, widgets, and menus. Various PHP modes include defined constants, functions, and more parameters. This helps a user save precious time. It allows them to surface any WordPress or PHP server data without relying on any complex tests or hardcode debug scripts.
These were the 8 must-have debugging tools for WordPress websites that you should make use of for your WordPress website. All these tools have different functionalities and roles that help you keep your WordPress websites bug-free and optimized for best performance. Being updated about the different back-end and front-end issues a website can face and having a solution ready for them would keep your websites safe and secure. It would also help you safeguard your visitor’s data and privacy, which would, in turn, add up to your credibility. Hence, if you are a developer or a theme designer, you can make use of all these tools to make your work efficient and easier.
Apart from using these tools, here are some WordPress tricks and tips for debugging your website using it’s built-in tools:
is_wp_error() :
This is another effective WordPress built-in tool that helps a user check if any result is caused by WP_Error. It is the returned object that a user would recieve when a WordPress method fails. For instance:
$post = array(
‘post_title’ => ‘Test post’,
‘post_content’ => ‘This is my post.’,
‘post_status’ => ‘publish’,
‘post_author’ => 1
);
$result = wp_insert_post( $my_post );
if(is_wp_error($result)){
echo $return->get_error_message();
}
If you add this code, it would attempt to insert a new post using wp_insert_post(). If you fail using this method, it should return WP_Error object. This would help you catch and get the error message.
Test Website:
As a web developer you need to have a habit of seperating the live website from your testing and developments. Always have two installs of any WordPress on your websites. This is crucial to ensure that turning on error reporting won’t cause your scripts to terminate.
WPBD Error Reporting:
If you make use of WPBD class for handling your database, you would need an error reporting mechanism. This would help you ensure your queries run smoothly or even to show error messages for debugging. For instance:
global $wpdb;
// Before running your query:
$wpdb->show_errors = TRUE;
$result = $wpdb->get_results(“SELECT field_value FROM table_name”);
if(! $result){
$wpdb->print_error();
// Or you can choose to show the last tried query.
echo $wpdb->last_query;
}
Server Log Errors:
There would be times where neither PHP or WordPress would be successful in catching some coding errors. For instance, when your script exceeds the maximum allowed run time, you won’t get any PHP error. You would just get a popup saying ‘Internal Server Error’. Instead, go to your error log, and check if your PHP code or any certain part of your WordPress installation had any errors or did something wrong.
PHP Syntax Checker:
If you are working on a hosting service that limits access to php.ini. file, or it doesn’t let you access error logs, it might make things more complicated. However, there are many capable tools that can help you solve any complications when you get a blank page with no error message.
Disable Browser Cache:
If you are more comfortable on the front-end of the website, then you can try simply disabling the cache of the browser you are working on. This is crucial if you are working on a JavaScript code and it stops updating, or keeps updating but stops showing new errors. In such cases you would need to disable cache. Doing so means that you are requesting your browser to stop working on any old stored files of your website. This also includes JavaScript and CSS files.
The post 8 Must Have Debugging Tools for WordPress Websites first appeared on Line25.
Source: https://ift.tt/32Vwovb


No comments:
Post a Comment