Creating charts or graphs can be relatively easy if you are using a Javascript visualization library. A library makes things easier for you and also makes available a lot of functions with which you could make lovely graphs to visualize your data.
These following tools are the ones you need if you are working on a website project where you have to create charts or graphs, like a stock market site, for example, or if you are making a visual presentation in HTML format.
D3.js
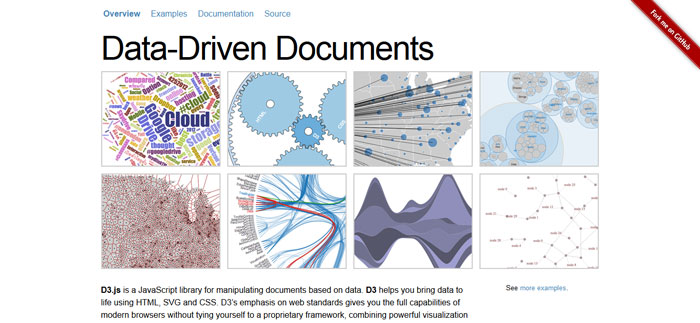
D3.js is a JavaScript library for manipulating documents based on data. D3 helps you bring data to life using HTML, SVG and CSS. D3’s emphasis on web standards gives you the full capabilities of modern browsers without tying yourself to a proprietary framework, combining powerful visualization components and a data-driven approach to DOM manipulation.
Raphaël
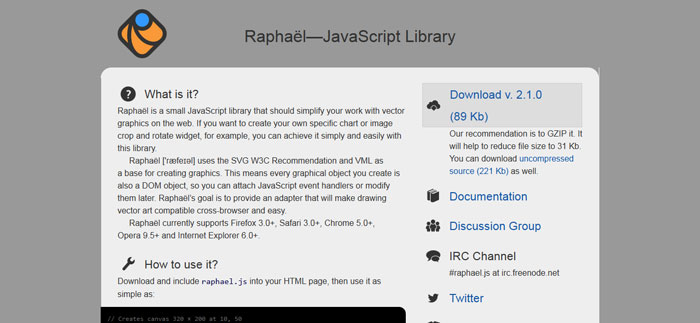
Raphaël is a small JavaScript library that should simplify your work with vector graphics on the web. If you want to create your own specific chart or image crop and rotate widget, for example, you can achieve it simply and easily with this library.
Raphaël uses the SVG W3C Recommendation and VML as a base for creating graphics. This means every graphical object you create is also a DOM object, so you can attach JavaScript event handlers or modify them later. Raphaël’s goal is to provide an adapter that will make drawing vector art compatible cross-browser and easy.
Rickshaw
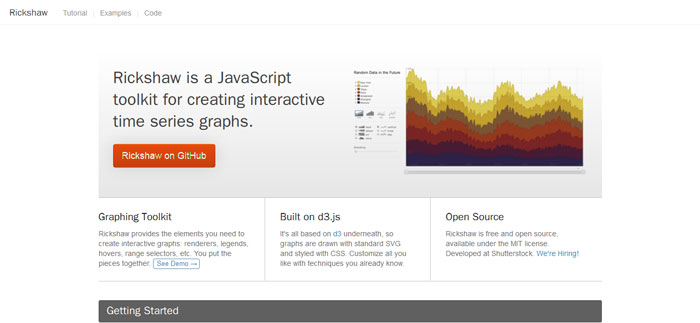
Rickshaw is a JavaScript toolkit for creating interactive time series graphs. Rickshaw provides the elements you need to create interactive graphs: renderers, legends, hovers, range selectors, etc.
Morris.js
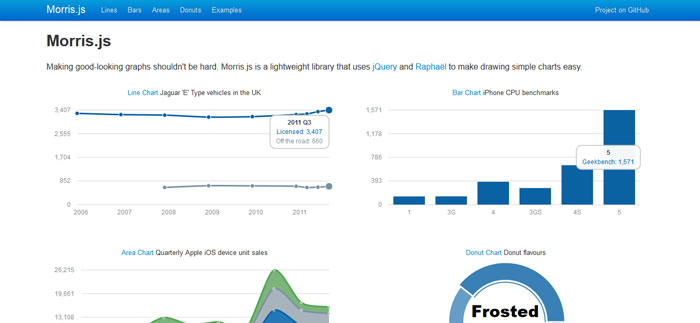
Making good-looking graphs shouldn’t be hard. Morris.js is a lightweight library that uses jQuery and Raphaël to make drawing simple charts easy.
Flotr2
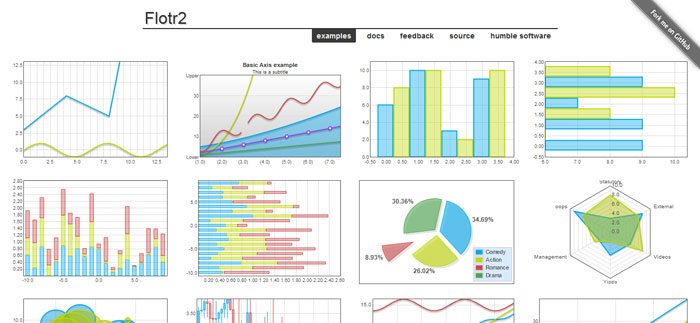
Flotr2 is a library for drawing HTML5 charts and graphs. It is a branch of flotr which removes the Prototype dependency and includes many improvements.
Bonsai

A lightweight graphics library with an intuitive graphics API and an SVG renderer.
dygraphs
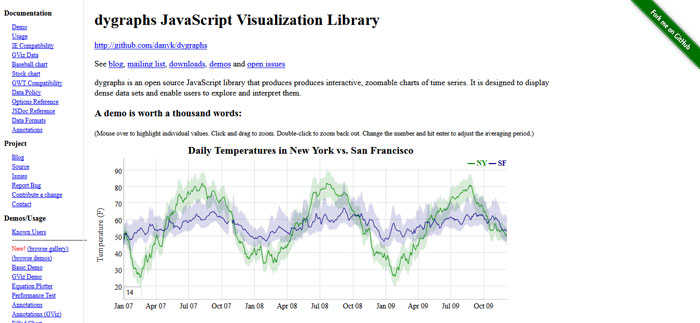
dygraphs is an open source JavaScript library that produces produces interactive, zoomable charts of time series. It is designed to display dense data sets and enable users to explore and interpret them.
sigma.js
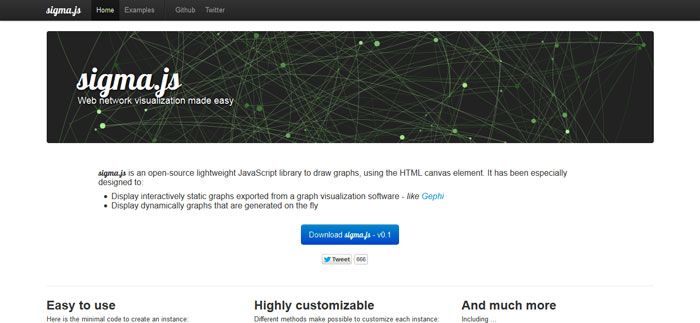
sigma.js is an open-source lightweight JavaScript library to draw graphs, using the HTML canvas element.
heatmap.js
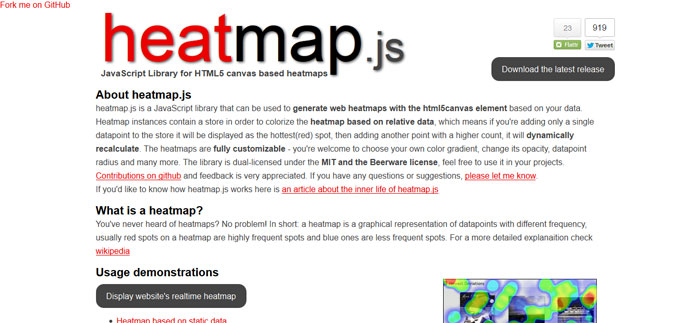
heatmap.js is a JavaScript library that can be used to generate web heatmaps with the html5canvas element based on your data. Heatmap instances contain a store in order to colorize the heatmap based on relative data, which means if you’re adding only a single datapoint to the store it will be displayed as the hottest(red) spot, then adding another point with a higher count, it will dynamically recalculate. The heatmaps are fully customizable – you’re welcome to choose your own color gradient, change its opacity, datapoint radius and many more.
JavaScript InfoVis Toolkit
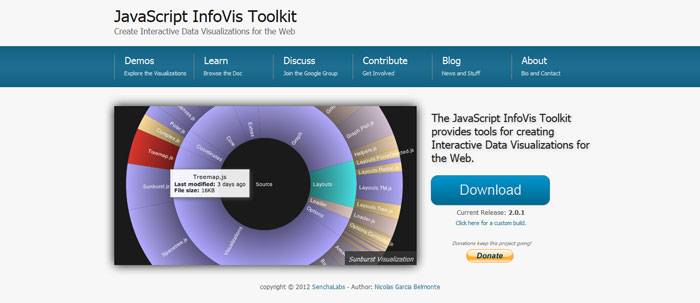
The JavaScript InfoVis Toolkit provides tools for creating Interactive Data Visualizations for the Web.
Envision.js
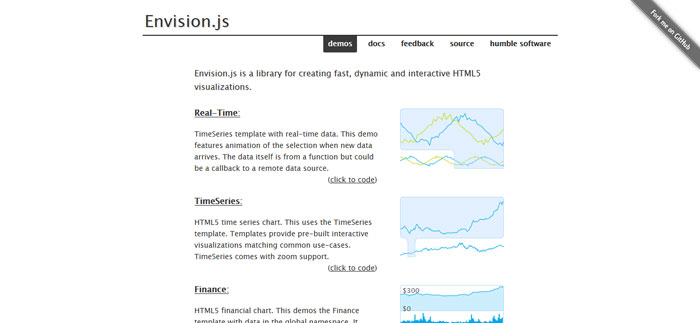
Envision.js is a library for creating fast, dynamic and interactive HTML5 visualizations.
VivaGraphJS
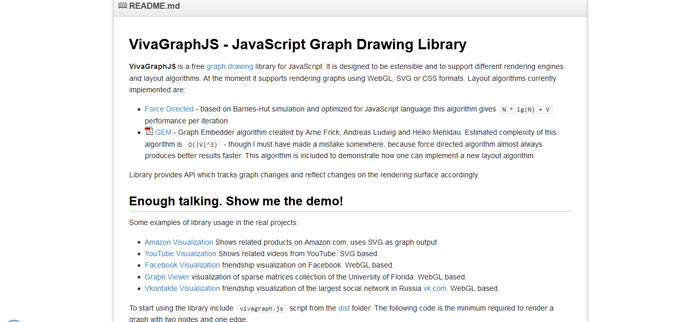
VivaGraphJS is a free graph drawing library for JavaScript. It is designed to be extensible and to support different rendering engines and layout algorithms. At the moment it supports rendering graphs using WebGL, SVG or CSS formats.
xCharts
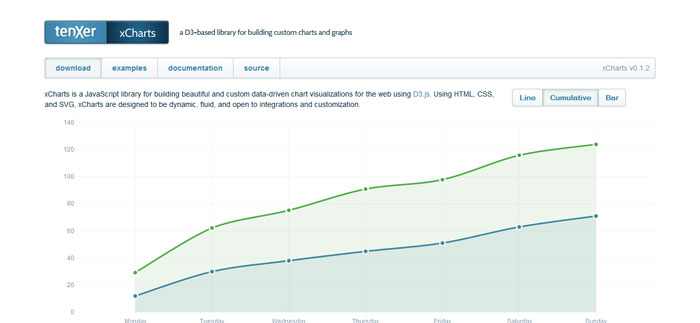
xCharts is a JavaScript library for building beautiful and custom data-driven chart visualizations for the web using D3.js. Using HTML, CSS,
and SVG, xCharts are designed to be dynamic, fluid, and open to integrations and customization.
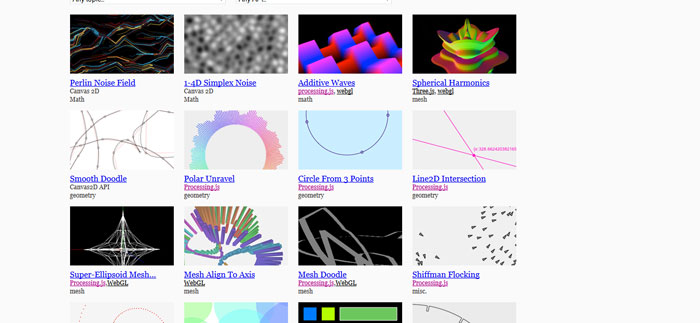
Processing.js
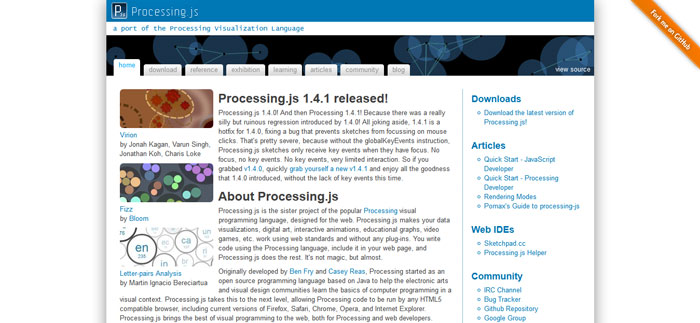
Processing.js is the sister project of the popular Processing visual programming language, designed for the web. Processing.js makes your data visualizations, digital art, interactive animations, educational graphs, video games, etc. work using web standards and without any plug-ins. You write code using the Processing language, include it in your web page, and Processing.js does the rest. It’s not magic, but almost.
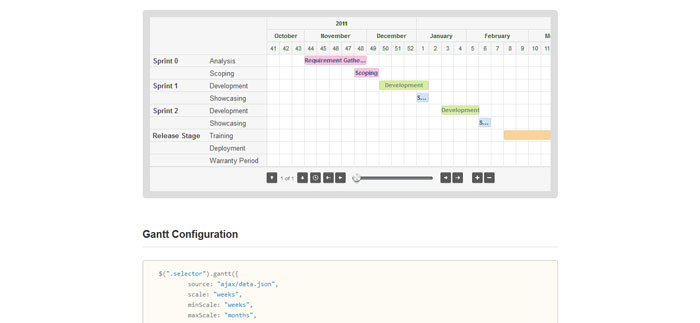
jQuery.Gantt: Draw Gantt charts with the famous jQuery ease of development
dc.js
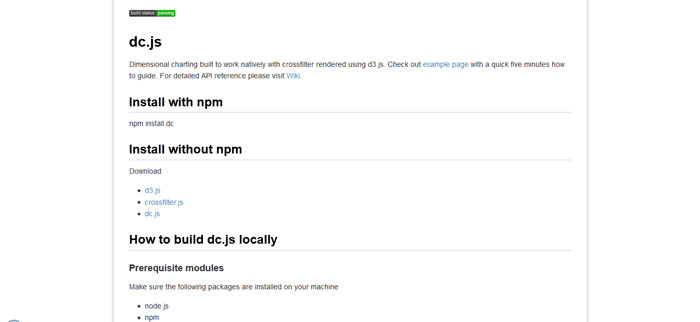
Dimensional charting built to work natively with crossfilter rendered using d3.js. Check out example page with a quick five minutes how to guide.
NVD3
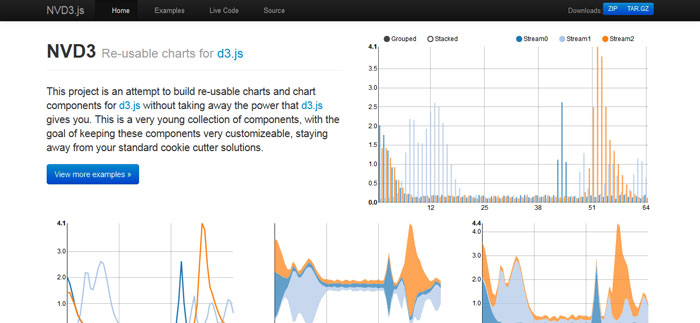
This project is an attempt to build re-usable charts and chart components for d3.js without taking away the power that d3.js gives you. This is a very young collection of components, with the goal of keeping these components very customizeable, staying away from your standard cookie cutter solutions.
jQuery.fracs
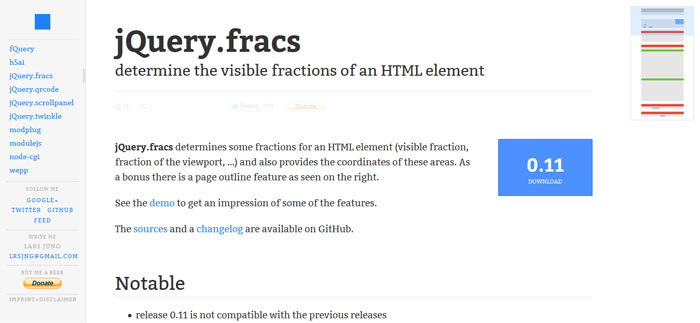
jQuery.fracs determines some fractions for an HTML element (visible fraction, fraction of the viewport, …) and also provides the coordinates of these areas. As a bonus there is a page outline feature as seen on the right.
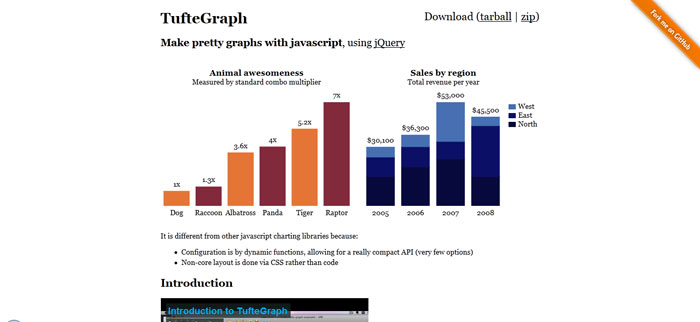
TufteGraph: Make pretty graphs with javascript, using jQuery
toxiclibs.js
Toxiclibs.js is a port of Karsten Schmidt’s Toxiclibs for Java and Processing. Toxiclibs.js works great with any DOM element, such as Canvas and SVG. The library is also available for use with Node.js for desktop applications and servers.
Ico
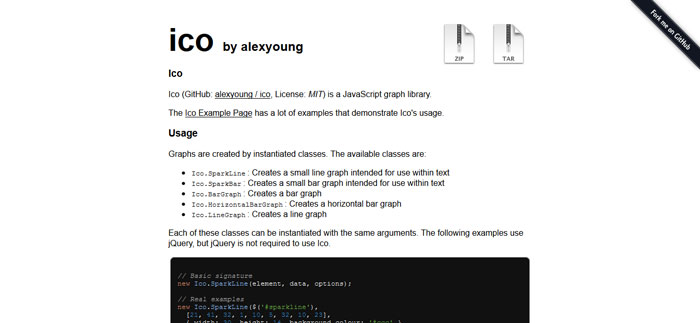
Ico is a JavaScript graph library that uses Raphael to draw. This means it can draw graphs in multiple browsers (including IE).
Unveil.js
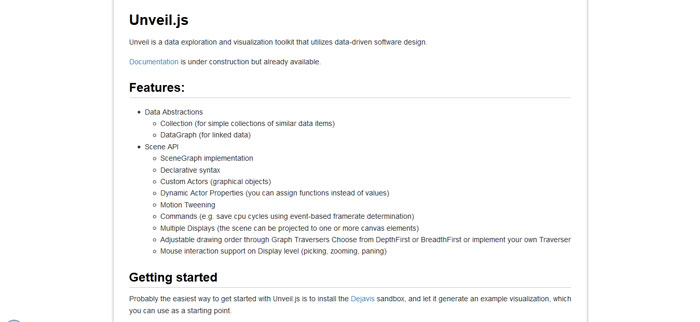
Unveil is a data exploration and visualization toolkit that utilizes data-driven software design.
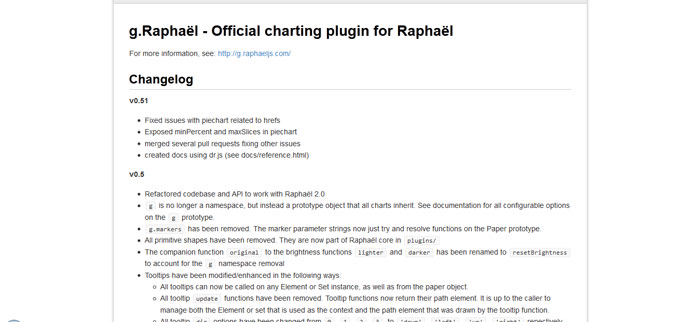
g.Raphaël – Official charting plugin for Raphaël
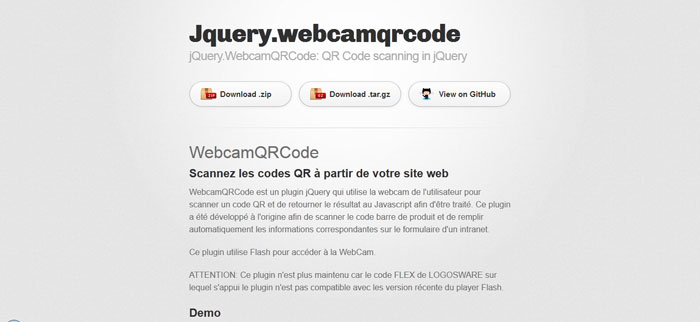
Jquery.webcamqrcode
jQuery Sparklines
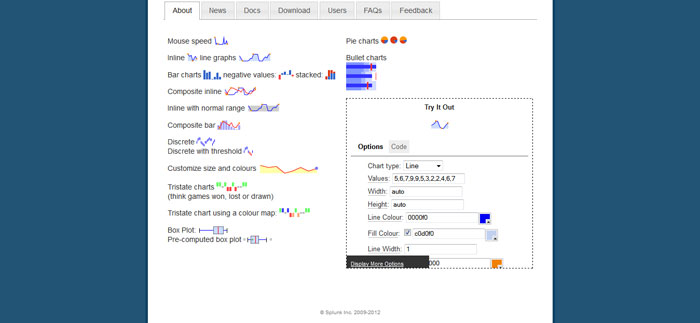
This jQuery plugin generates sparklines (small inline charts) directly in the browser using data supplied either inline in the HTML, or via javascript.
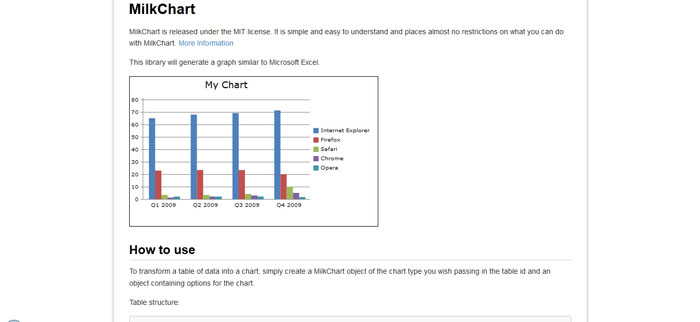
MilkChart
Harry Plotter
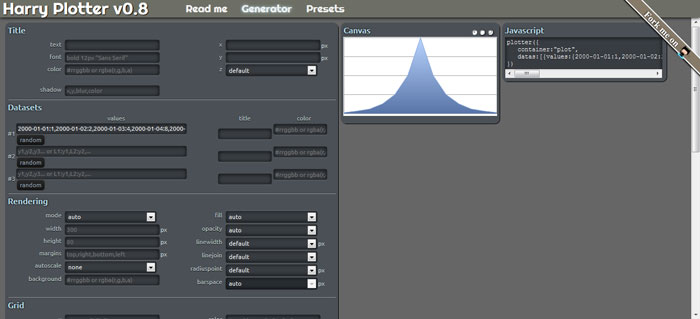
Harry is a lightweight standalone javascript library to plot data as charts, pies, lines or curves.
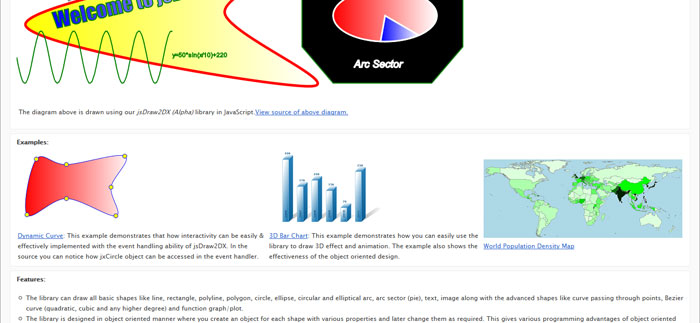
jsDraw2DX : SVG Graphics Library for JavaScript (HTML5 Ready)
Highcharts
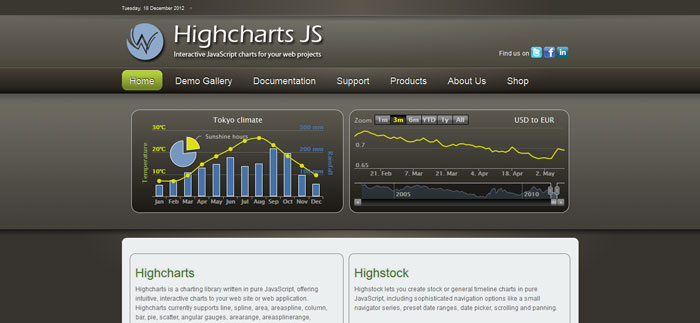
Highcharts is a charting library written in pure JavaScript, offering intuitive, interactive charts to your web site or web application. Highcharts currently supports line, spline, area, areaspline, column, bar, pie, scatter, angular gauges, arearange, areasplinerange, columnrange and polar chart types.
jQuery.qrcode
jQuery.qrcode enables you to dynamically add QR codes to your website. Choose between rendering the code in a canvas or with divs. The latter will be fine even for older browser. The QR code will always be in the least possible type/resolution.
KeyLines
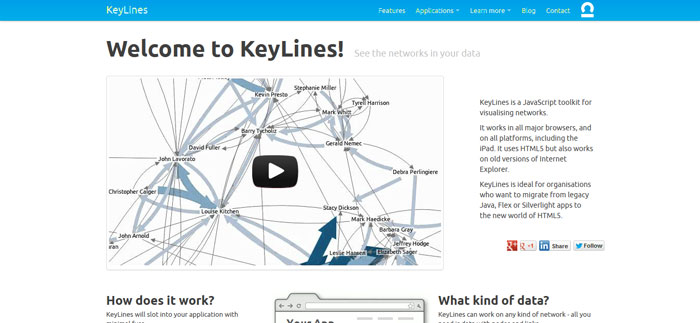
KeyLines is a JavaScript toolkit for visualising networks. It works in all major browsers, and on all platforms, including the iPad. It uses HTML5 but also works on old versions of Internet Explorer.
KeyLines is ideal for organisations who want to migrate from legacy Java, Flex or Silverlight apps to the new world of HTML5.
Timeplot
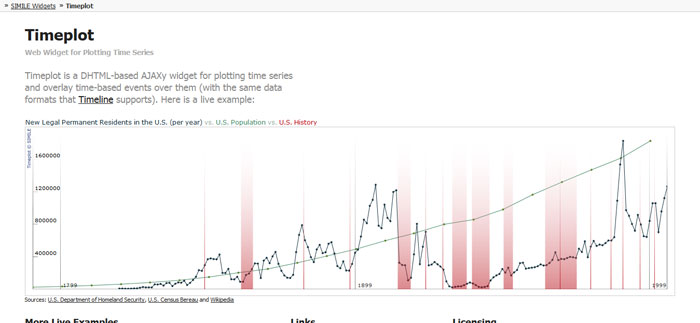
Timeplot is a DHTML-based AJAXy widget for plotting time series and overlay time-based events over them (with the same data formats that Timeline supports).
jqPlot
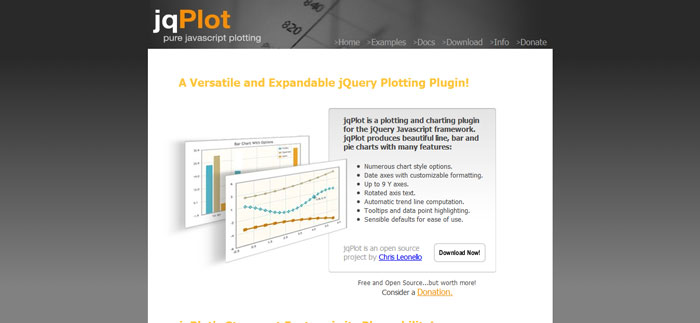
jqPlot is a plotting and charting plugin for the jQuery Javascript framework. jqPlot produces beautiful line, bar and pie charts with many features
JS Charts
JS Charts is a JavaScript based chart generator that requires little or no coding. With JS Charts drawing charts is a simple and easy task, since you only have to use client-side scripting (i.e. performed by your web browser). No additional plugins or server modules are required. Just include our scripts, prepare your chart data in XML, JSON or JavaScript Array and your chart is ready!
Source: http://feedproxy.google.com/~r/DesignResourceBox/~3/5jiw3emKxEM/


No comments:
Post a Comment