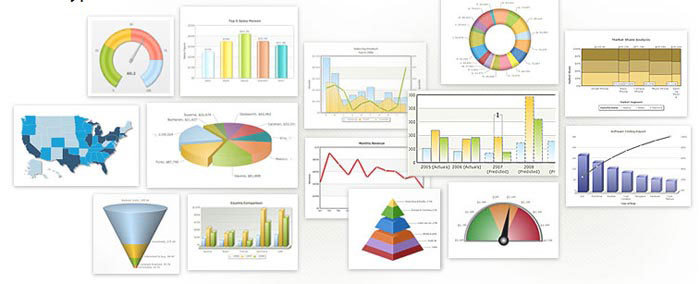
Graph and chart tools are very popular among web designers and web developers because clients ask them to be implemented in their dashboards and presentations. FusionCharts offers a lot of charting solutions that you may find useful: column charts, bar charts, pie charts and various other types that can be rendered in 2D or 3D.
Initially when it was launched, FusionCharts offered Flash graphs but since then they evolved beautifully and now there are also Javascript charts and can also be viewed on mobile devices. Actually, at this moment their charts are working on almost every device possible: PCs, Macs, iPads, iPhones or Android devices.

Using charts is not that easy if you want to use a tool that works and looks good too. FusionCharts does this well and can be implemented easily by a web designer. What it does is it takes all the information that you want in charts and graphs and turns it into interactive charts that can be implemented in CRM applications, in project management applications, social media analytics software or in large-scale BI/ERP applications.
Using their tools is not that difficult too. There are tutorials and extensive documentation that will guide you through every part of the process. You don’t even have to be a techie to figure out how to use them.
One of their products, FusionCharts XT, is a perfect addition to reports, dashboards, surveys, monitors and analytics. Its comprehensive range of chart types with smart reporting capabilities, animations and interactivity are bound to make your apps look stunning and power-packed.
It doesn’t matter if it’s a simple column or pie chart, a combination chart, advanced zoom and scroll charts, or specialized sales and marketing charts, FusionCharts XT covers all your charting requirements. All the charts support interactive options like tooltips, drill-down, exporting as image, PDF, or CSV and JavaScript integration.
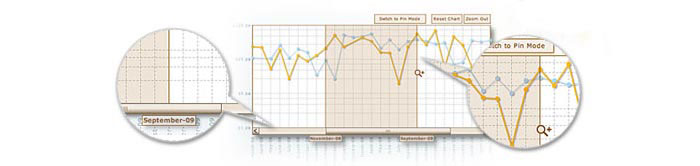
I’ve made an article a while back about chart and graph tools that are available on the web and I was impressed that FusionCharts offered a lot of features. Things like tooltips, clickable legend keys, easy drill-down, effortless zooming and scrolling, one-click chart export and print gives your users all the capabilities they expect from a modern-day business app.
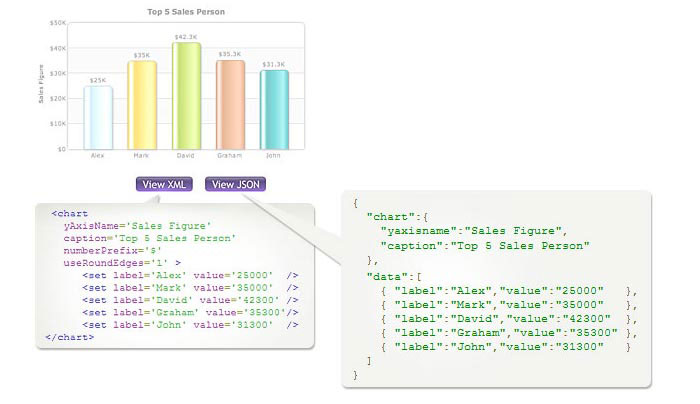
You can use your data with FusionCharts in two ways, with the help of XML or JSON. People are usually running away from XML, but it is extremely easy and well-documented.
If your data is from a database, you can use the FusionCharts XT API. The application also supports real-time data visualization from an external source.
FusionCharts jQuery plugin
Using the jQuery charts plugin is not difficult at all. As well as with all their products and features, this too is well documented. It requires only 4 simple steps:
- Download jQuery and FusionCharts Suite XT. Copy the downloaded JavaScript files to the relevant folder in your web application
- Include jQuery.min.js, FusionCharts.js and FusionCharts.jQueryPlugin.js in your web page
- Create aor a container to hold the chart
- Use insertFusionCharts(), appendFusionCharts() or prependFusionCharts() method to create the chart instance, and provide attributes like width, height, data format and data object
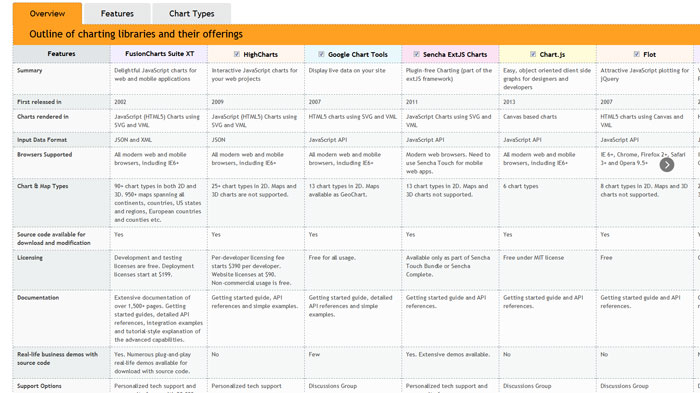
To be sure that what I’m telling you is not propaganda you can check a comparison between the top Javascript/HTML5 charting libraries.
Source: http://feedproxy.google.com/~r/DesignResourceBox/~3/P7Mw-hLx9TM/


No comments:
Post a Comment